
Advertisement
Advertisement
Inflation Data Rally: Will Stocks Continue Higher?
By:
Key Points:
- The S&P 500 is likely to open flat and fluctuate following yesterday’s record-breaking rally.
- On Friday, April 19, stock prices were the lowest since February, indicating a correction of the medium-term advance. Yesterday, the S&P 500 retraced all of its mid-April sell-off, reaching a new record high above 5,300.
- In my opinion, the short-term outlook is neutral.

In this article:
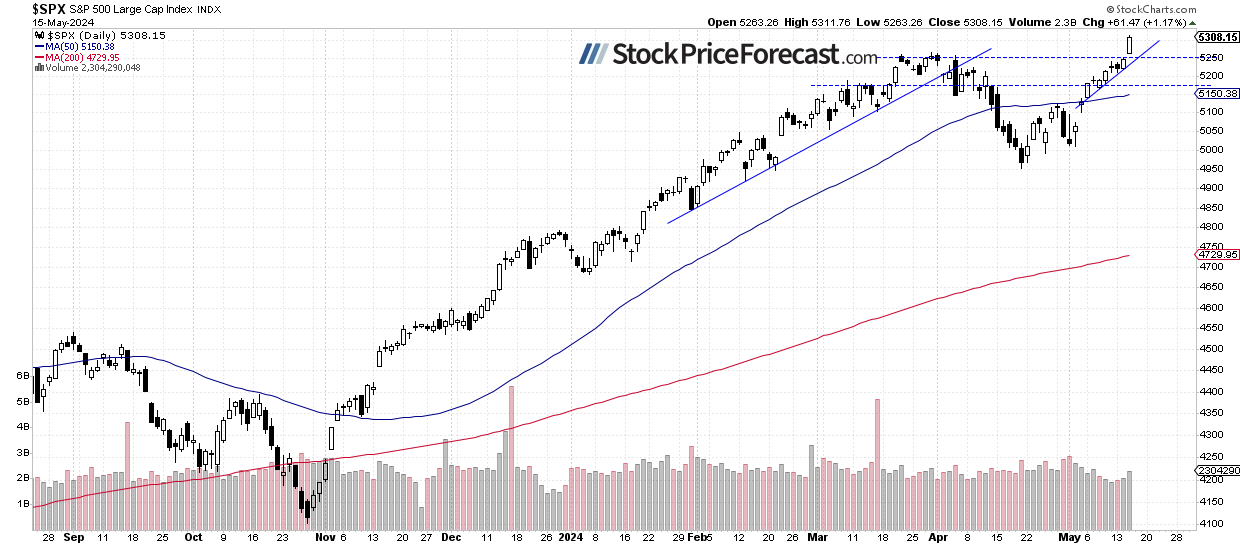
The S&P 500 index gained 1.17%, closing above the 5,300 level and reaching a new all-time high of 5,311.76. It broke above local highs from March and April, completely retracing the recent 6% correction.
On Monday, I noted ”The question arises: will the S&P 500 continue its bull market and reach a new record? It seems more and more likely; however, the index may see some short-term uncertainty as it approaches a series of the previous local highs and resistance levels.”
However, this uncertainty was short-lived. Yesterday, the market broke out of a three-day consolidation below the 5,250 level. This morning, S&P 500 futures are indicating a slightly higher opening for thew index.
Investor sentiment remains high, as indicated by yesterday’s AAII Investor Sentiment Survey, which showed that 40.9% of individual investors are bullish, while only 23.3% of them are bearish. The AAII sentiment is a contrary indicator in the sense that highly bullish readings may suggest excessive complacency and a lack of fear in the market. Conversely, bearish readings are favorable for market upturns.
The S&P 500 has accelerated its uptrend, breaking above the previous highs, as we can see on the daily chart.
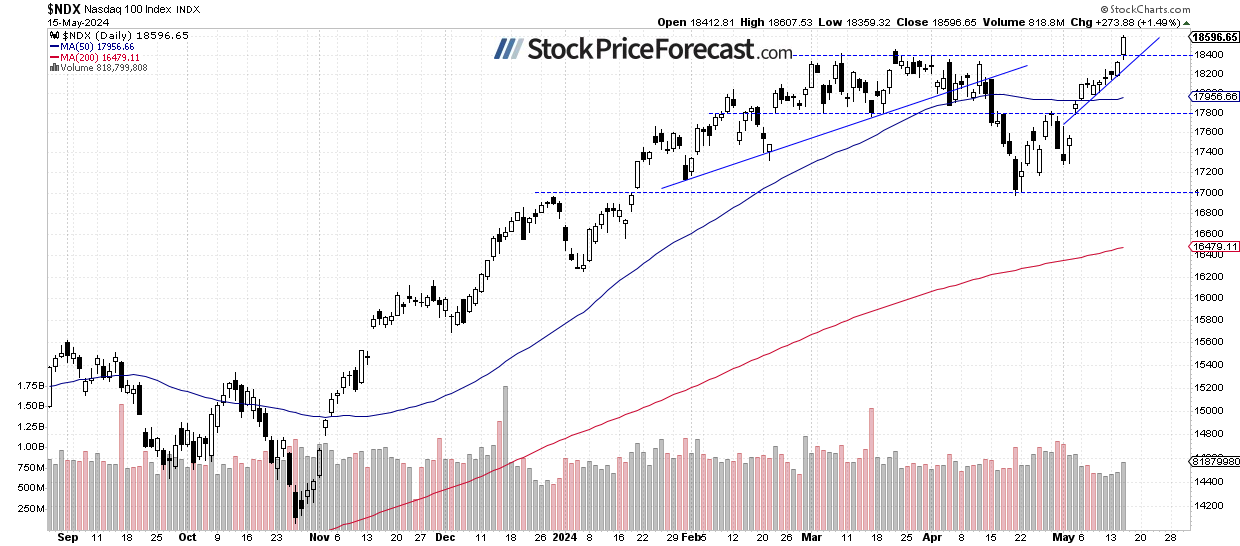
Nasdaq 100 Breaks 18,500
Last week, the technology-focused Nasdaq 100 index has been mostly fluctuating along the 18,000 level. However, on Friday, it broke higher and retraced more of its previous declines. Yesterday, it reached a new record high of 18,607.53, before closing 1.49% higher. Today, the tech stocks gauge is likely to open virtually flat.
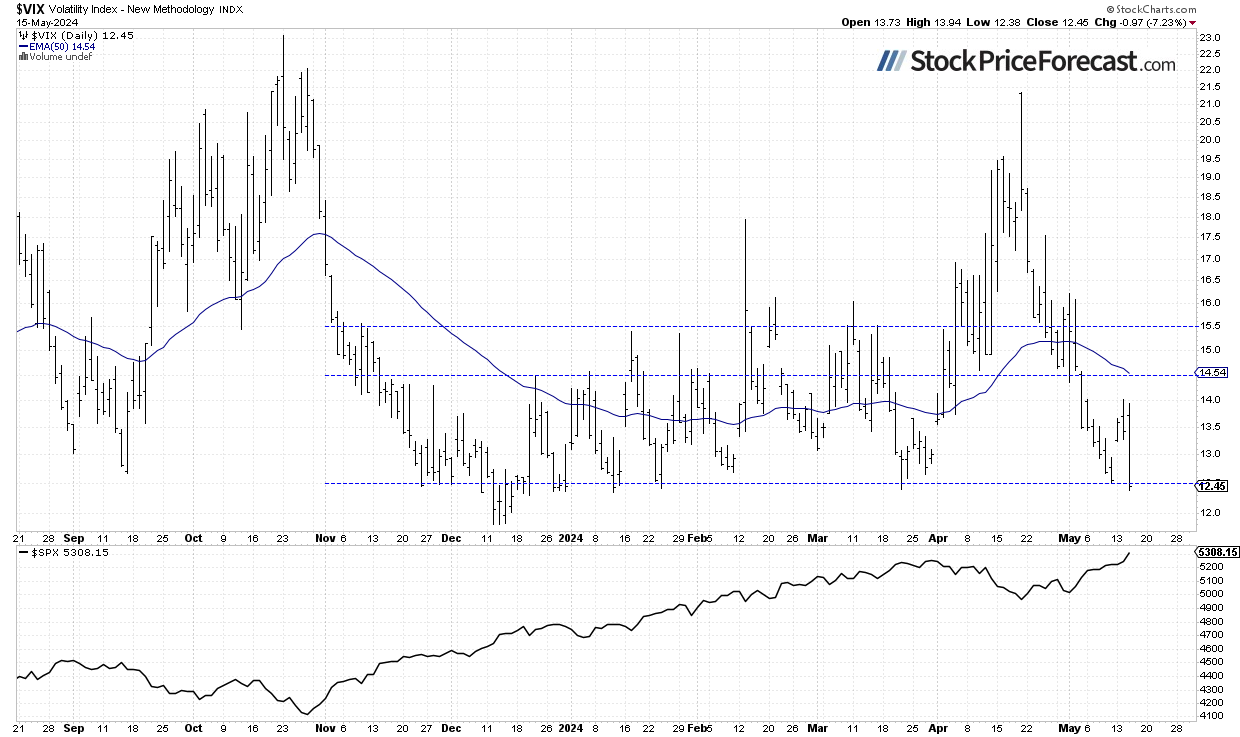
VIX Below 12.50
The VIX index, also known as the fear gauge, is derived from option prices. In late March, it was trading around the 13 level. However, market volatility led to an increase in the VIX, and on April 19, it reached a local high of 21.4 – the highest since late October, signaling fear in the market. Recently, it was going lower again, and yesterday, it was as low as 12.38, showing complacency in the market.
Historically, a dropping VIX indicates less fear in the market, and rising VIX accompanies stock market downturns. However, the lower the VIX, the higher the probability of the market’s downward reversal.
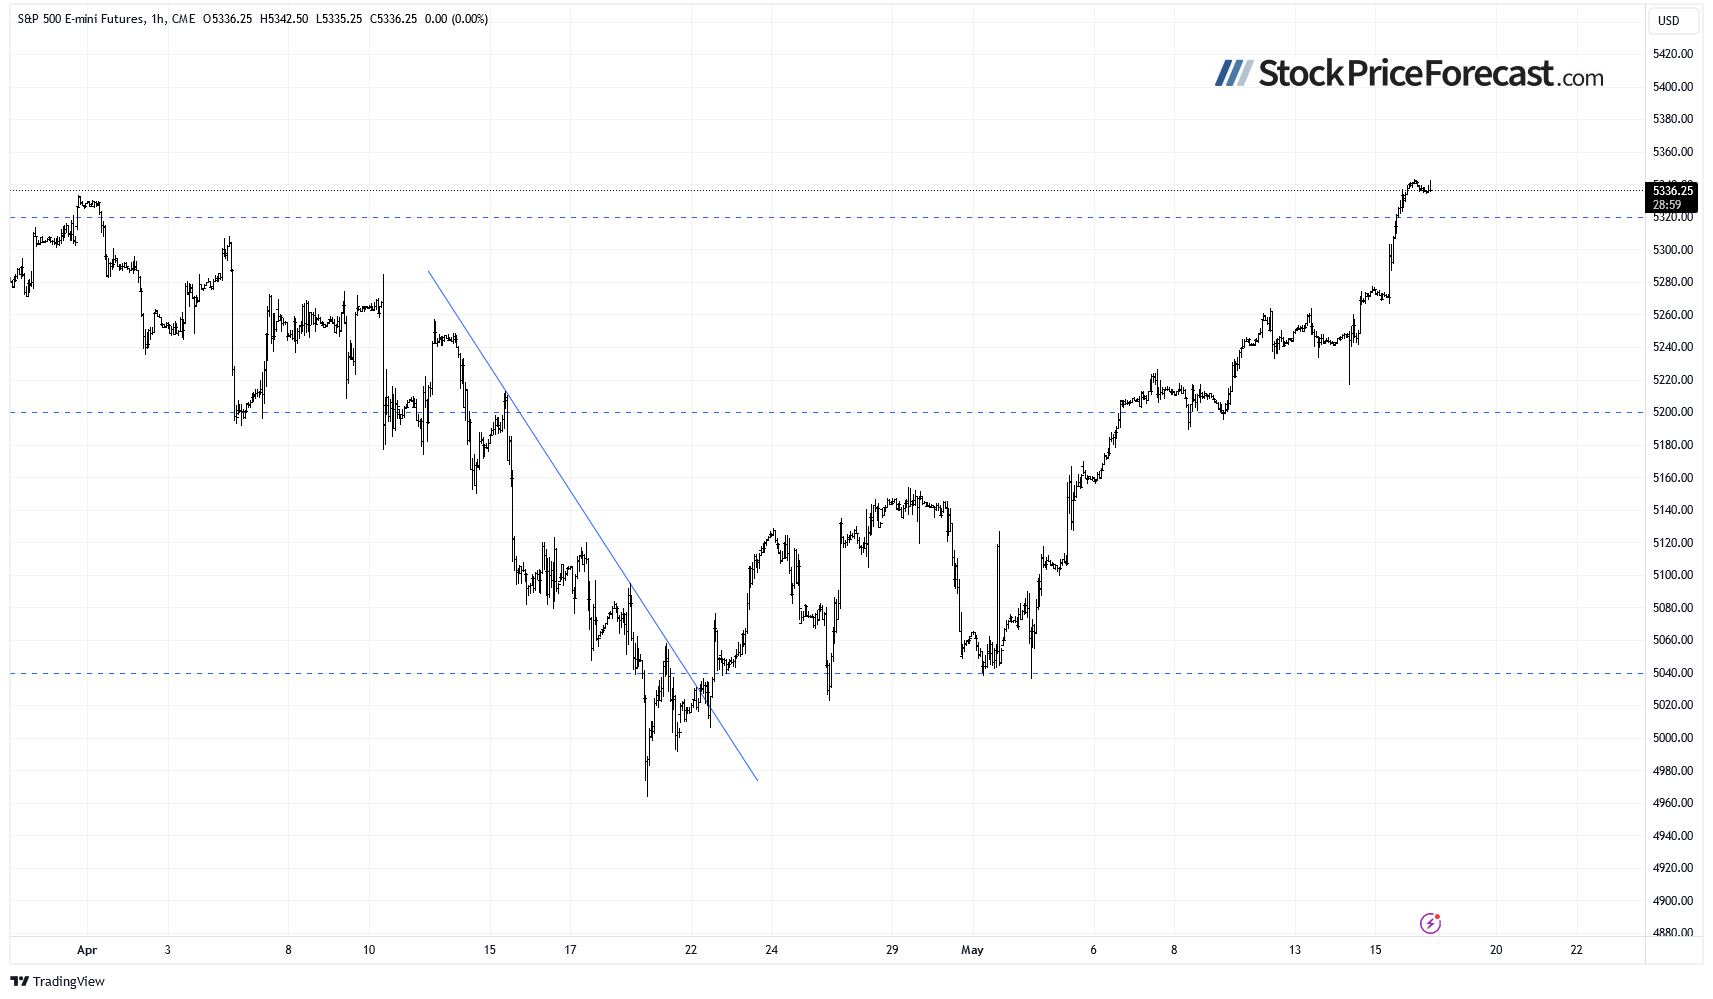
Futures Contract Remains Above 5,300
Let’s take a look at the hourly chart of the S&P 500 futures contract. The consumer inflation release led to a quick rally reaching new local highs above the 5,300 level yesterday. This morning, the market is trading within a consolidation and relatively flat correction of that rally. The support level is now at 5,280-5,300.
Conclusion
The S&P 500 index is likely to open virtually flat this morning despite a series of economic data, including Unemployment Claims and the Philly Fed Manufacturing Index. The market is trading along its new record high, so it is also likely that the S&P 500 will see more new highs.
Last Tuesday, I wrote “(…) the market may pause or even retrace some gains. With most of the earnings season over (there is only one very important release left – NVDA on May 22) and the FOMC Rate Decision release behind us, expect a period of uncertainty.”
The uncertainty seemed to be gone, but the overall bullish sentiment coupled with low VIX readings may be worrying for the market in the short-term. Some profit-taking may be on the horizon.
In my Stock Price Forecast for May, I noted “Where will the market go in May? There’s a popular saying: ‘Sell in May and go away,’ but statistics don’t consistently support such clear seasonal patterns or cycles. The safe bet for May is likely sideways trading, with investors digesting recent data suggesting that inflation may not be transitory, and the Fed could maintain its relatively tight monetary policy. However, economic data isn’t entirely negative, and strong earnings from companies may continue to fuel the bull market.”
For now, my short-term outlook remains neutral.
The full version of today’s analysis – today’s Stock Trading Alert – includes the additional analysis of the Apple (AAPL) stock and the current S&P 500 futures contract position. I encourage you to subscribe and read the details today. Stocks Trading Alerts are also a part of our Diamond Package that includes Gold Trading Alerts and Oil Trading Alerts.
And if you’re not yet on our free mailing list, I strongly encourage you to join it – you’ll stay up-to-date with our free analyses that will still put you ahead of 99% of investors that don’t have access to this information. Join our free stock newsletter today.
About the Author
Paul Rejczakcontributor
Stock market strategist, who has been known for the quality of his technical and fundamental analysis since the late nineties.
Did you find this article useful?
Latest news and analysis


Advertisement