
Advertisement
Advertisement
Gold, Silver And WTI Crude Oil: Technical Checks
By:
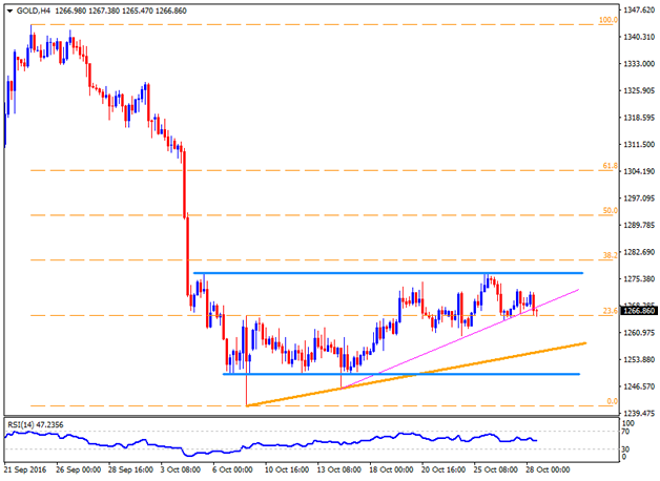
GOLD Following its failure to break $1276.50 – $1277.30 horizontal-resistance, the Gold prices recently dipped below an immediate ascending trend-line
GOLD
Following its failure to break $1276.50 – $1277.30 horizontal-resistance, the Gold prices recently dipped below an immediate ascending trend-line support of $1267.70 ahead of the US GDP release, indicating a quick decline to $1260. However, an upbeat US growth figures can further drag the quote to below $1260 towards another upward slanting trend-line support of $1255, breaking which the yellow metal may extend its downturn to 1249.50 and then to the present-month lows of $1241.30. In case if the metal price breaks 1241.30, also clear $1240 round figure, chances of its fresh south-run towards $1235-32 can’t be denied. On the upside, $1275.50 can act as nearby resistance for the Gold before it can challenge the $1276.50 – $1277.30 area. Should the Gold prices clear $1277.30, it could rally to $1288 and then to the $1297 while its after-moves might find it hard to clear $1300 psychological magnet.
SILVER
Unlike Gold, the Silver prices are yet to clear the nearby ascending trend-line support of $17.55, breaking which $17.40 and the $17.30 horizontal support. Should the upbeat US details fetch the quote below $17.30, the present month low around $17.00 might act as intermediate halt during the metal’s southward trajectory towards $16.90, $16.70 and $16.50 supports. Alternatively, $17.75 and the descending trend-line resistance of $17.85, followed by $18.00, are likely nearby upside figures that could come-up on the chart if the metal reverses from present levels. Given the quote rallies beyond $18.00, it becomes capable enough to advance towards $18.50 resistances.
WTI CRUDE OIL
With its gradual downside from $51.90, the Crude prices are forming a short-term descending trend-channel pattern, which signals the energy’s south-run. At present, the Crude is likely to test 38.2% Fibonacci Retracement level of its latest upswing, at $48.75, breaking which channel support of $48.00 becomes an important level for traders to watch. If the Crude price dips below $48.00, it becomes weaker enough to plunge towards $46.60 and the $46.00 downside figures. Meanwhile, the $49.60 channel-resistance can continue limiting the energy’s immediate price up-moves, clearing that its fresh north-run to $50.00 and then to the $50.70 might please the Bulls. In case of further prices-rise by Crude beyond $50.70, $51.30 and the $51.90 are likely buffer levels to observe prior to expecting the quote to flash $52.30 on the chart.
Cheers and Safe Trading,
Anil Panchal
About the Author
Anil Panchalauthor
An MBA (Finance) degree holder with more than five years of experience in tracking the global Forex market. His expertise lies in fundamental analysis but he does not give up on technical aspects in order to identify profitable trade opportunities.


Advertisement