
Advertisement
Advertisement
Trade of the Day – March U.S. Dollar Index – February 5, 2016
By:
Now that the dust has cleared after the initial reaction to today’s U.S. Non-Farm Payrolls report, it’s time to take a look at the March U.S. Index
Now that the dust has cleared after the initial reaction to today’s U.S. Non-Farm Payrolls report, it’s time to take a look at the March U.S. Index futures contract.
The U.S. Dollar rallied on Friday as investors digested mixed U.S. employment data. According to the Bureau of Labor Statistics, the U.S. economy added 151,000 jobs in January. Economists were looking for an increase of 189K. The government also adjusted downward the December figures.
On paper, the headline number looked weak, and the dollar declined initially. However, the unemployment rate fell to 4.9% and the Average Hourly Earnings came in stronger at 0.5%, beating the 0.3% estimate.
With the unemployment rate improving and average hourly earnings surging, investors ratcheted up the possibility of another Fed rate hike in 2016, driving up the U.S. Dollar.
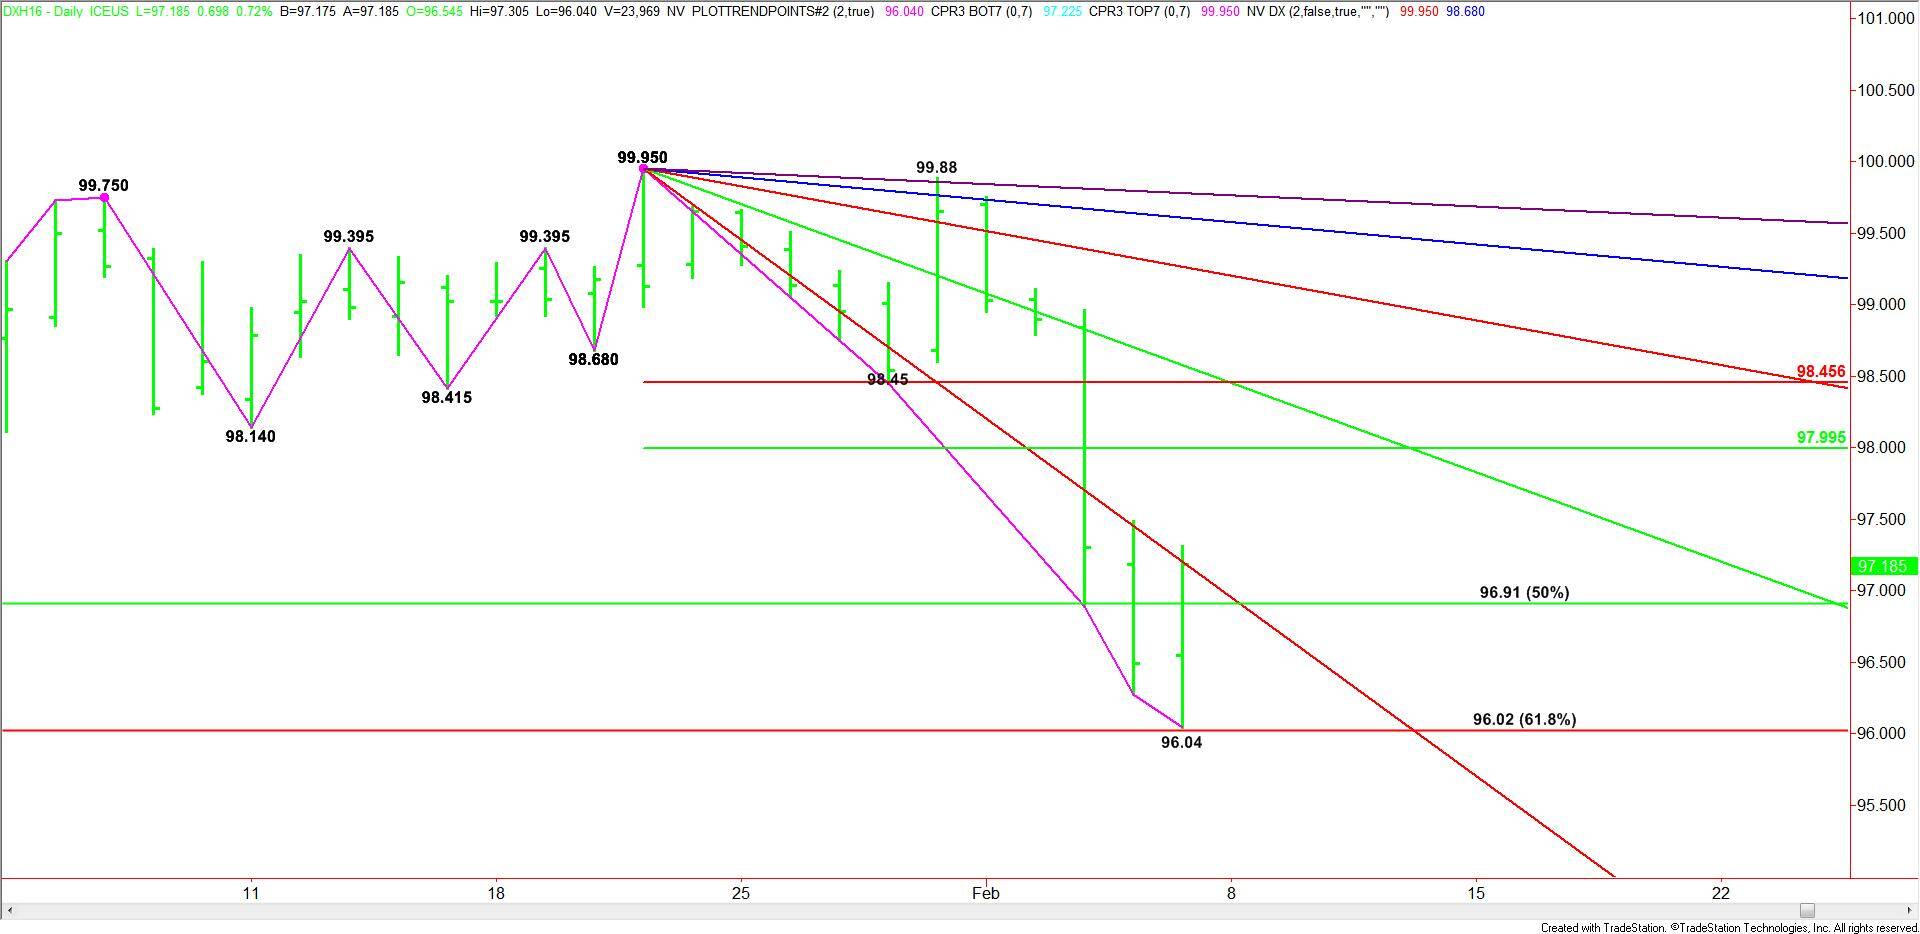
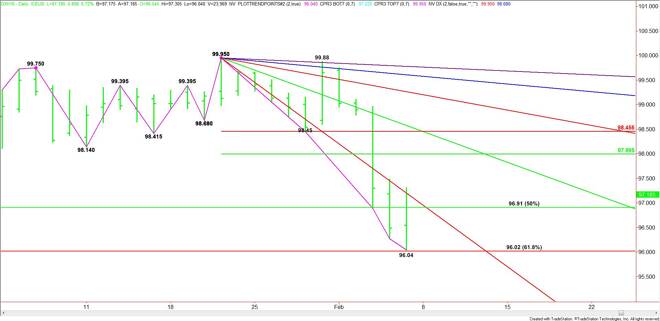
Technically, the main trend is down according to the daily swing chart, but the market did find support after the release of the report at 96.04. This was slightly above the major long-term Fibonacci level at 96.02.
The subsequent rally blew out short-sellers who took positions earlier in the week. The initial rally took out the major long-term 50% level at 96.91. Upside momentum eventually drove the index through a steep downtrending angle at 97.20, but the rally stopped at 97.305 and broke back towards support.
We feel that there is still enough upside potential in the market to play the long side into the close especially since some of the panic trading has subsided, but mostly because the index is now in a position to post a potentially bullish closing price reversal bottom on the daily chart.
If looking to buy on a pullback then the first level to watch for support and your entry is the main 50% level at 96.91.
A second possible entry price is the intraday 50% retracement level of today’s range. The range is 96.04 to 97.305 so the support price comes in at 96.67.
Still a third entry level is yesterday’s close at 96.48. If there is a stronger than expected intraday retracement then this price is the next likely target. The market has to close over this level to produce the potentially bullish closing price reversal bottom.
The fourth potential trading opportunity it another breakout over the downtrending angle at 97.20. These will be a pure momentum play. Enough buyers are going to have to come in to drive the market through this angle and hold the market above it.
It should be noted that these are counter-trend recommendations. Therefore, traders have to watch the price action and read the order flow at each potential entry level.
About the Author
James Hyerczykauthor
James is a Florida-based technical analyst, market researcher, educator and trader with 35+ years of experience. He is an expert in the area of patterns, price and time analysis as it applies to futures, Forex, and stocks.
Did you find this article useful?
Latest news and analysis


Advertisement