
Advertisement
Advertisement
US Dollar Index (DX) Futures Technical Analysis – July 21, 2016 Forecast
By:
September U.S. Dollar Index futures are trading lower as investors take a breather ahead of today’s European Central Bank monetary policy announcement and

September U.S. Dollar Index futures are trading lower as investors take a breather ahead of today’s European Central Bank monetary policy announcement and a slew of fresh U.S. economic data.
The ECB is expected to leave interest rates and its current stimulus package in place, but it may deliver a dovish tone due to its concerns over the U.K.’s plan to leave the European Union. Since housing starts moved the dollar earlier in the week, investors will also be watching today’s Existing Home Sales figures closely.
The main trend is up according to the daily swing chart. The main trend will turn down on a trade through the last swing bottom at 95.84.
The major range is 100.95 to 92.00. Its retracement zone is 96.475 to 97.53. Yesterday’s rally to 97.37 fell short of the major Fib level at 97.53, suggesting that investors recognize this price as key resistance.
The short-term range is 95.84 to 97.37. Its 50% level or pivot is 96.61. This price forms a loose support cluster with the major 50% level at 96.475, making it a valid downside target.
The 50% level at 96.475 forms an even tighter support cluster with an uptrending angle at 96.47. This cluster is the best downside target.
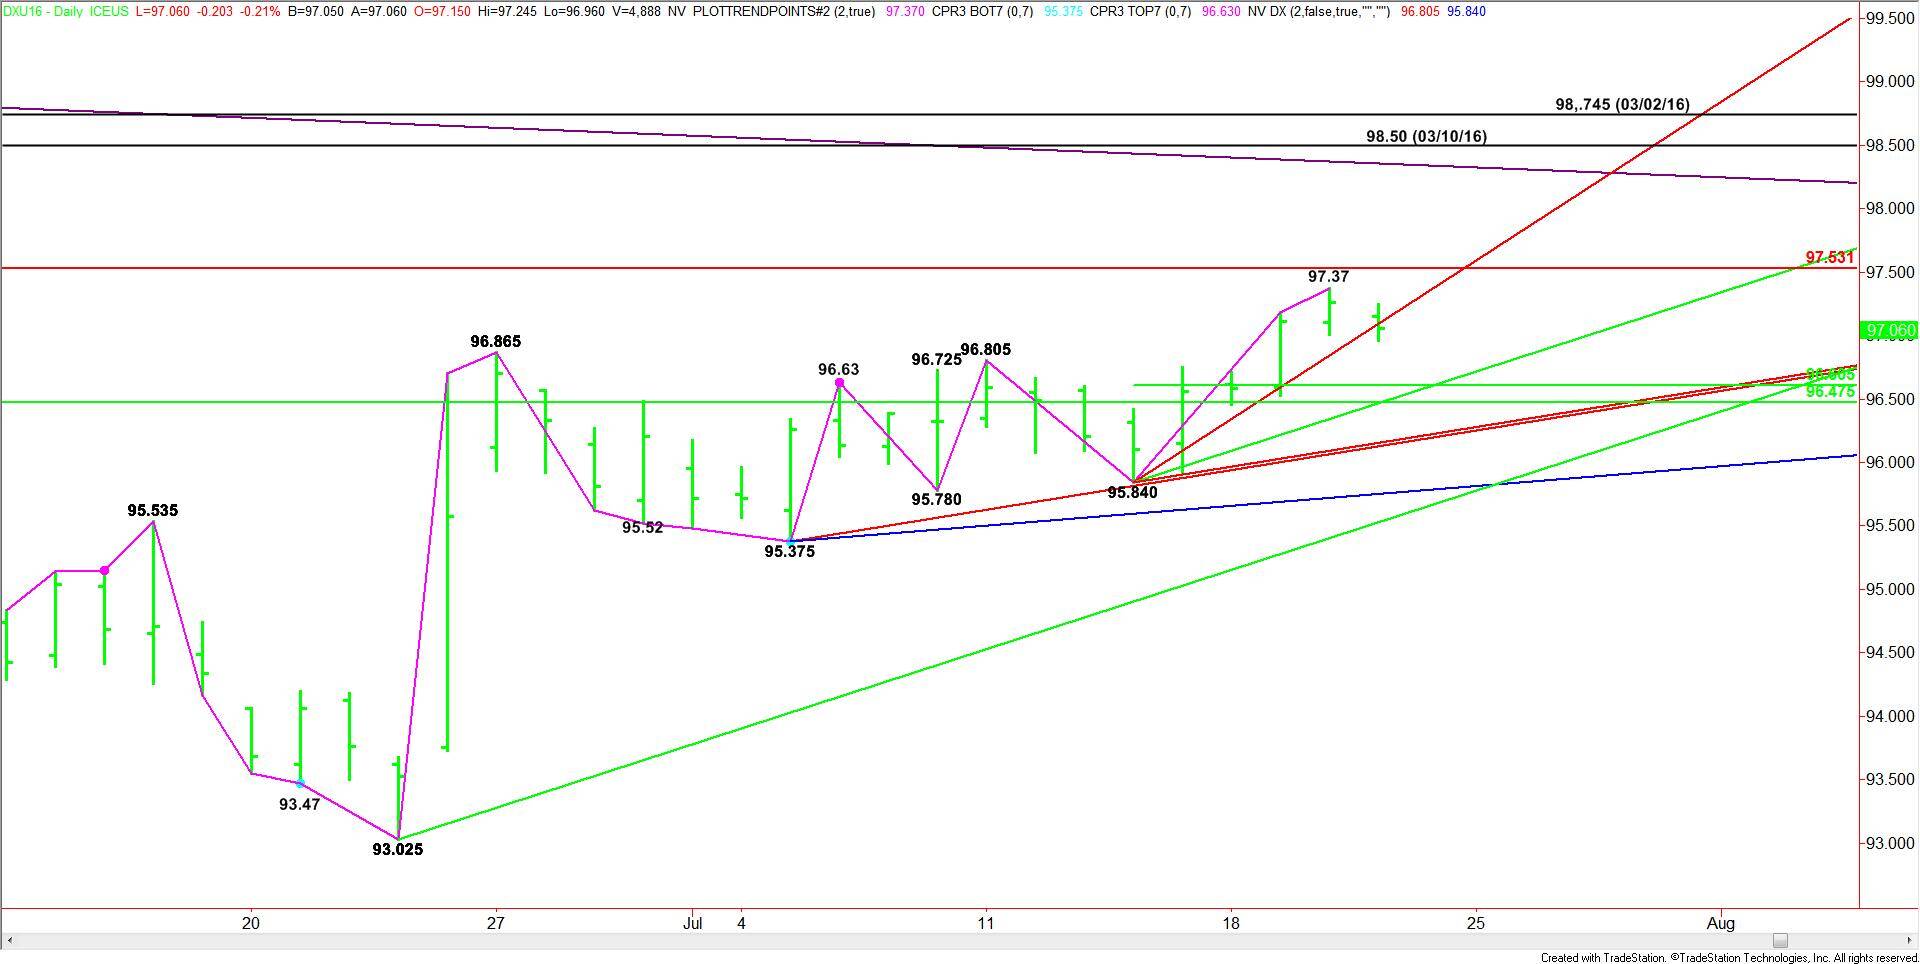
Based on the current price at 96.96, the direction of the dollar index today is likely to be determined by trader reaction to the uptrending angle at 97.09.
A sustained move over 97.09 will signal the presence of buyers. This could create enough upside momentum to challenge yesterday’s high at 97.37 then the major Fib level at 97.53. The Fib level is the trigger point for a steep move to the upside with major targets coming in at 98.36 and 98.50.
A sustained move under 97.09 will indicate the presence of sellers. The daily chart is wide open to the downside under this angle with the next targets coming in at 96.61 and 96.47.
If 96.47 can’t hold as support then look for the selling to extend into a pair of uptrending angles at 96.15 and 96.13.
Watch the price action and read the order flow at 97.09. Trader reaction to this angle should determine the direction of the market today.
About the Author
James Hyerczykauthor
James is a Florida-based technical analyst, market researcher, educator and trader with 35+ years of experience. He is an expert in the area of patterns, price and time analysis as it applies to futures, Forex, and stocks.
Did you find this article useful?
Latest news and analysis


Advertisement