
Advertisement
Advertisement
Weekly Technical Outlook: GBP/USD; Market Forecasts for September 12th – September 16th
Published: Sep 12, 2016, 10:38 GMT+00:00
Resistance level 1.34523 Pivot Level 1.33192 Support Level 1.30601, 1.29480 and 1.2857 Technical Analysis Daily bias in GBP/USD remains bearish with
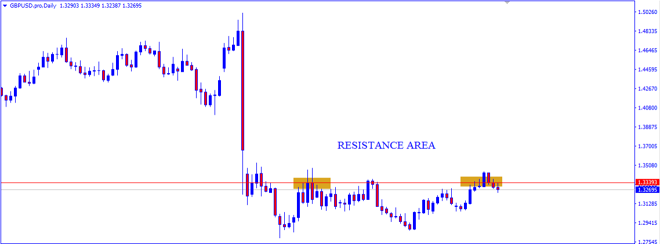
- Resistance level 1.34523
- Pivot Level 1.33192
- Support Level 1.30601, 1.29480 and 1.2857
Technical Analysis
Daily bias in GBP/USD remains bearish with 1.34523 resistances intact.
Deeper decline is still expected for the pair as long as resistances hold the area. The price action stays below resistances so far at this point and such a decline is viewed as a correction.
Thus, we’d expect resistance to hold the area and the pair remains bearish with weekend closing indicating a bearish reversal. The outlook continues with a downside bias price action signaling a two bar indicating a reversal bearish movement with rejection at resistance area closed below the trend line.
With the stochastic oscillator currently at 72.0 levels, the pair closed below the rejection of trend line. There is a clear indication of trend reversal shifting the momentum.
The current development suggests that the medium term downside is expected to be further low and focus shall be at 1.30601. This level breaks here and should make lower lows with 1.29480 levels.
Economic
- Producer Price Index, PPI Core Output, Consumer Price Index
- Core Consumer Price Index, Average Earnings Including/Excluding Bonus
- BoE Asset, Interest Rate Decisions, Bank of England Minutes, BOE MPC Vote Hike
- FOMC Member Brainard Speech, 10 Year Note Auction, Monthly Budget Statement
- Export/Import Price Index, EIA Crude Oil Stocks change,
- Retail Sales Initial Jobless Claims, Consumer Price Index
Area of Interest
- Strong resistance at 1.34523 area and closed below resistance levels.
- Bearish reversal strongly closing below the rejection of trend line with two bar signal.
- Price action closed below trend line and oscillator below 72.0 levels indicating shift in momentum.
- At Flip Area on Daily time frame resistance levels.
For more detailed analysis from the author, please visit NoaFX.
About the Author
Sylvester Stephencontributor


Advertisement