
Advertisement
Advertisement
S&P 500 Approaching 5,200: A New Leg of the Bull Market?
By:
Key Points:
- The S&P 500 is likely to go sideways following the recent rally.
- On Friday, April 19, stock prices were the lowest since February, indicating a correction of the medium-term advance; yesterday, the S&P 500 retraced almost all of its mid-April sell-off.
- In my opinion, the short-term outlook is neutral.

In this article:
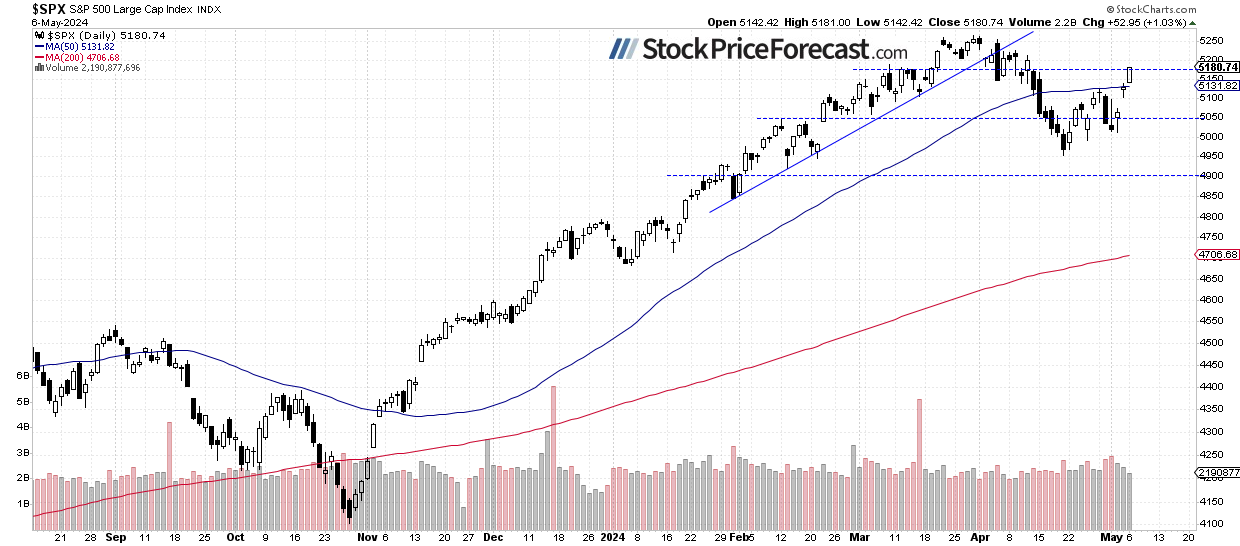
Last Friday, the index gained 1.3% following a 0.9% advance on Thursday. Why did stock prices advance? Investor sentiment remained positive following a series of quarterly earnings releases last week and less inflationary economic data, possibly signaling Fed monetary policy easing.
On Friday, April 19, the index hit a new medium-term low of 4,953.56. This marked its lowest level since late February, with a decline of over 311 points or 5.9% from the record high of 5,264.85 on February 28. However, stock prices rebounded as Middle East tensions eased, shifting investor focus to quarterly earnings releases.
This morning, stocks are likely to open virtually flat, as the S&P 500 futures contract hovers around yesterday’s closing price. The market may see a short-term consolidation following recent gains.
Last Wednesday, in my Stock Price Forecast for May, I noted “The question arises: Is this merely a correction or the beginning of a more significant downtrend? It’s difficult to determine at this point. Last month, hopes for a Fed pivot were dashed as new data reignited inflation fears, and geopolitical tensions added further uncertainty. However, as of today, it appears the market is only correcting a rally that began in November.”
The investor sentiment improved last week, as indicated by the Wednesday’s AAII Investor Sentiment Survey, which showed that 38.5% of individual investors are bullish, while 32.5% of them are bearish. The AAII sentiment is a contrary indicator in the sense that highly bullish readings may suggest excessive complacency and a lack of fear in the market. Conversely, bearish readings are favorable for market upturns.
The S&P 500 retraced even more of its mid-April sell-off yesterday, as we can see on the daily chart.
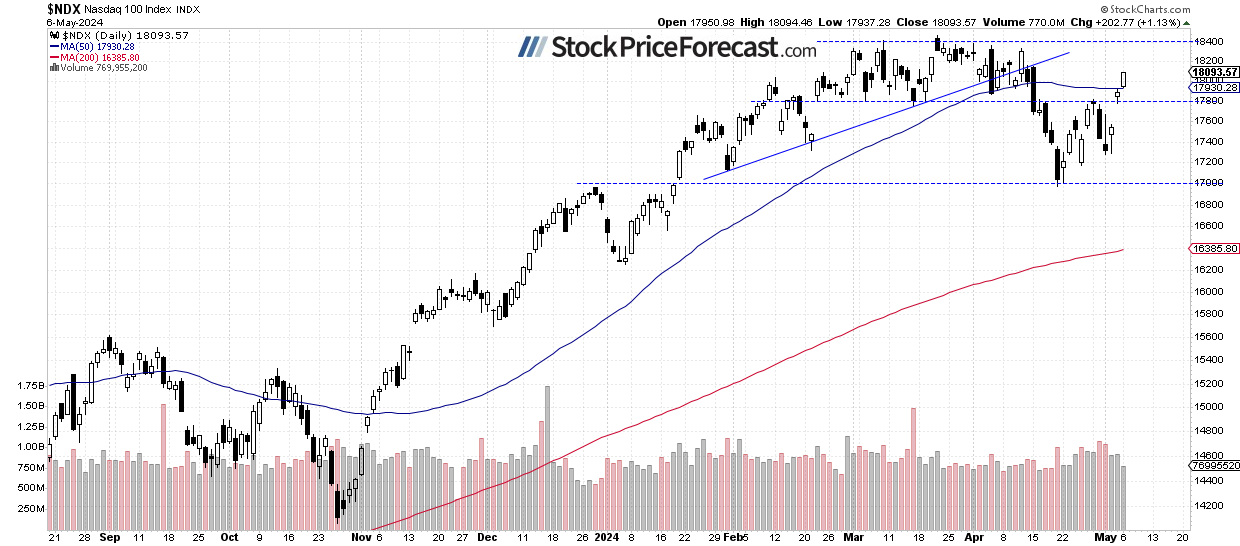
Nasdaq 100 Broke Above 18,000
The technology-focused Nasdaq 100 index gained 1.13% yesterday, extending its Thursday’s and Friday’s advances and breaking above the 18,000 level. However, it approached a potential resistance, marked by the previous local highs along the 18,200-18,400 level.
On Friday, the market rallied after the earnings release from AAPL. This morning, the Nasdaq 100 is expected to open 0.1% lower.
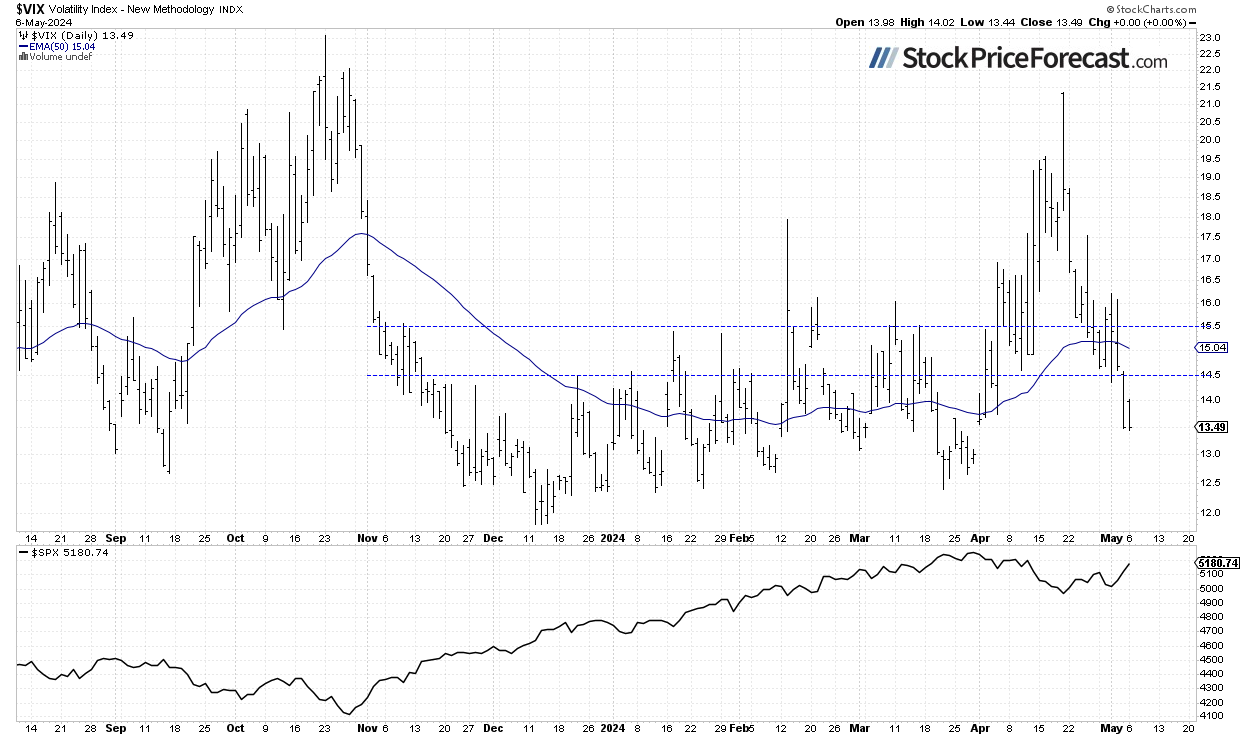
VIX Remains Below 14
The VIX index, also known as the fear gauge, is derived from option prices. In late March, it was trading around the 13 level. However, market volatility has led to an increase in the VIX, and on previous Friday, it reached a high of 21.4 – the highest since late October, signaling fear in the market. Recently it went lower again, and yesterday, it was as low as 13.44, showing more complacency in the market.
Historically, a dropping VIX indicates less fear in the market, and rising VIX accompanies stock market downturns. However, the lower the VIX, the higher the probability of the market’s downward reversal.
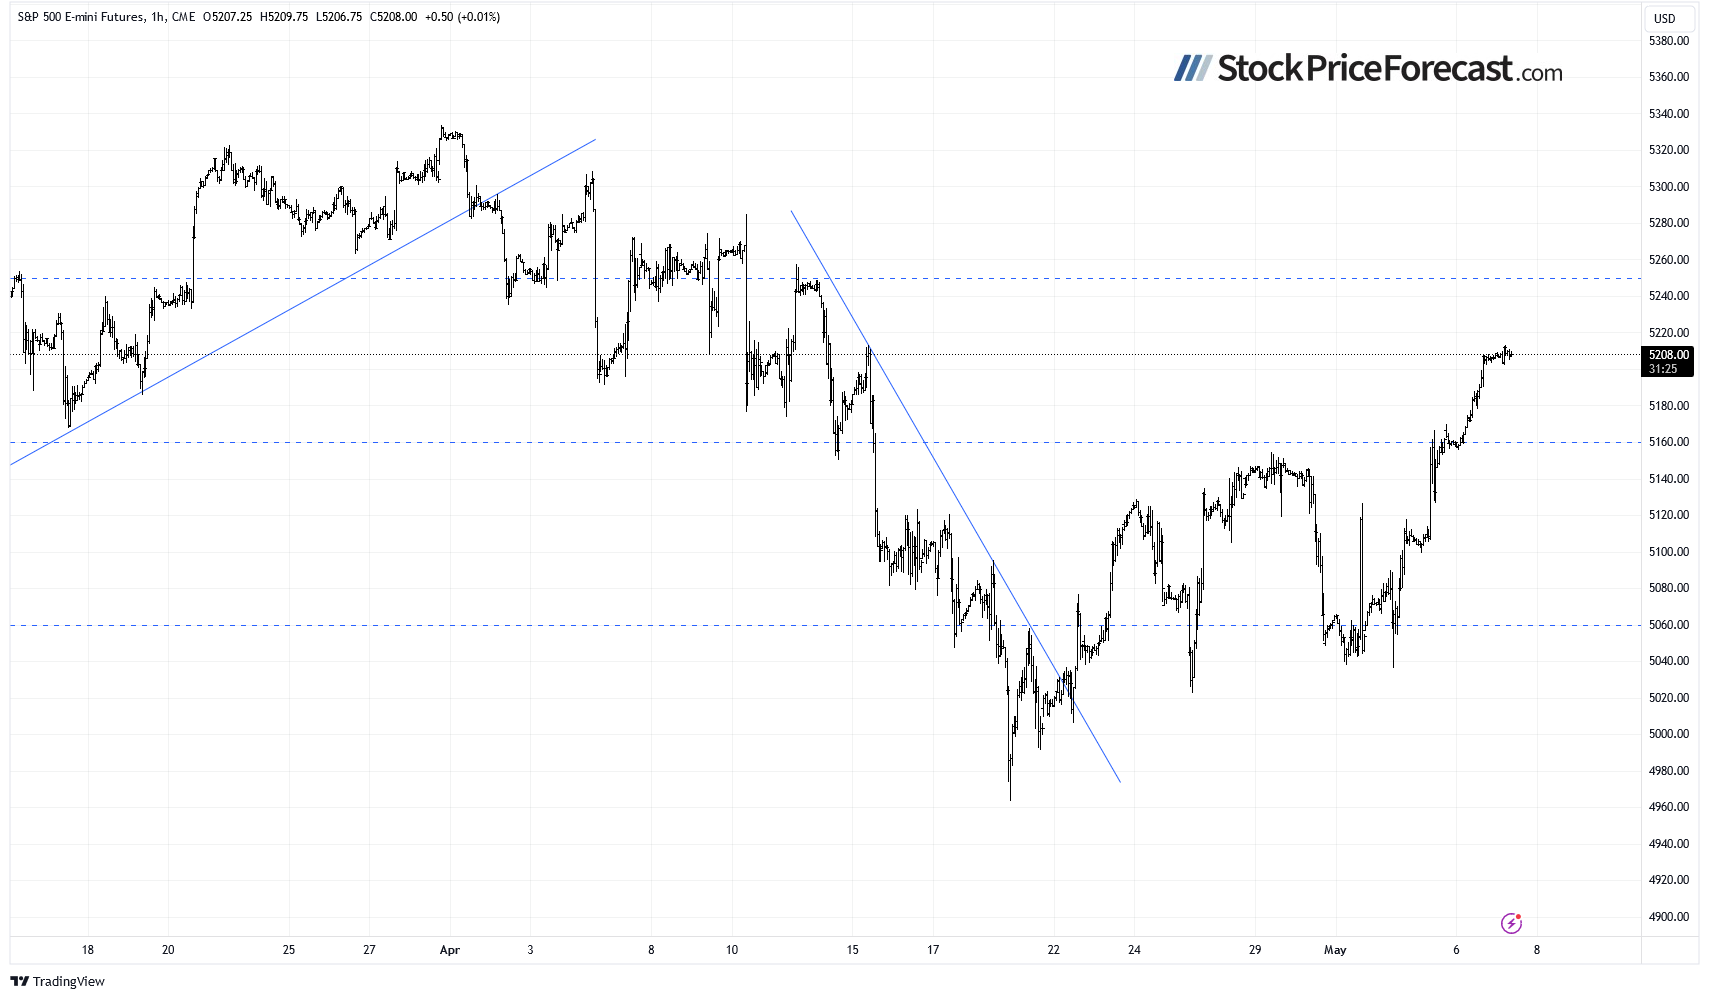
Futures Contract – Slightly Above 5,200
Let’s take a look at the hourly chart of the S&P 500 futures contract. This morning, it is trading within a relatively narrow price range as it remains slightly above the 5,200 level. The nearest resistance level is at 5,220, and the support level is now at 5,160, among others.
Conclusion
The recent sessions were bullish, with the S&P 500 index extending its rebound towards the 5,200 level. Today, the market may pause or even retrace some gains. With most of the earnings season over (there is only one very important release left – NVDA on May 22) and the FOMC Rate Decision release behind us, expect a period of uncertainty.
In the first half of April, the S&P 500 was continuing a correction from the March 28 record high of 5,264.85 on Middle East tensions, strong U.S. dollar. Recently, it sold off below the important 5,000 level, and last week, it kept retracing the declines as earnings and economic data lifted the sentiment again.
In my Stock Price Forecast for May, I added “Where will the market go in May? There’s a popular saying: ‘Sell in May and go away,’ but statistics don’t consistently support such clear seasonal patterns or cycles. The safe bet for May is likely sideways trading, with investors digesting recent data suggesting that inflation may not be transitory, and the Fed could maintain its relatively tight monetary policy. However, economic data isn’t entirely negative, and strong earnings from companies may continue to fuel the bull market.”
For now, my short-term outlook remains neutral.
The full version of today’s analysis – today’s Stock Trading Alert – is bigger than what you read above, and it includes the additional analysis of the Apple (AAPL) stock and the current S&P 500 futures contract position. I encourage you to subscribe and read the details today. Stocks Trading Alerts are also a part of our Diamond Package that includes Gold Trading Alerts and Oil Trading Alerts.
And if you’re not yet on our free mailing list, I strongly encourage you to join it – you’ll stay up-to-date with our free analyses that will still put you ahead of 99% of investors that don’t have access to this information. Join our free stock newsletter today.
About the Author
Paul Rejczakcontributor
Stock market strategist, who has been known for the quality of his technical and fundamental analysis since the late nineties.
Did you find this article useful?
Latest news and analysis


Advertisement