



Gold (XAU) rebounded towards $4,150 on Thursday as the US dollar and Treasury yields eased after the CPI selloff. But persistent inflation keeps further rate hikes by the Fed in focus, while heavy government borrowing could limit relief in bond yields. The market now awaits US producer prices and retail sales data for clues about the Fed’s next move. In my view, the break above $4,200 would strengthen the recovery in the gold price, while a drop below $3,900 would increase the risk of deeper correction. This article presents the economic drivers and technical levels that may shape the next move in gold.
Gold Price Fundamentals: CPI, Treasury Yields and Fed Policy
Hot CPI Keeps Fed Rate Hike Risks in Focus
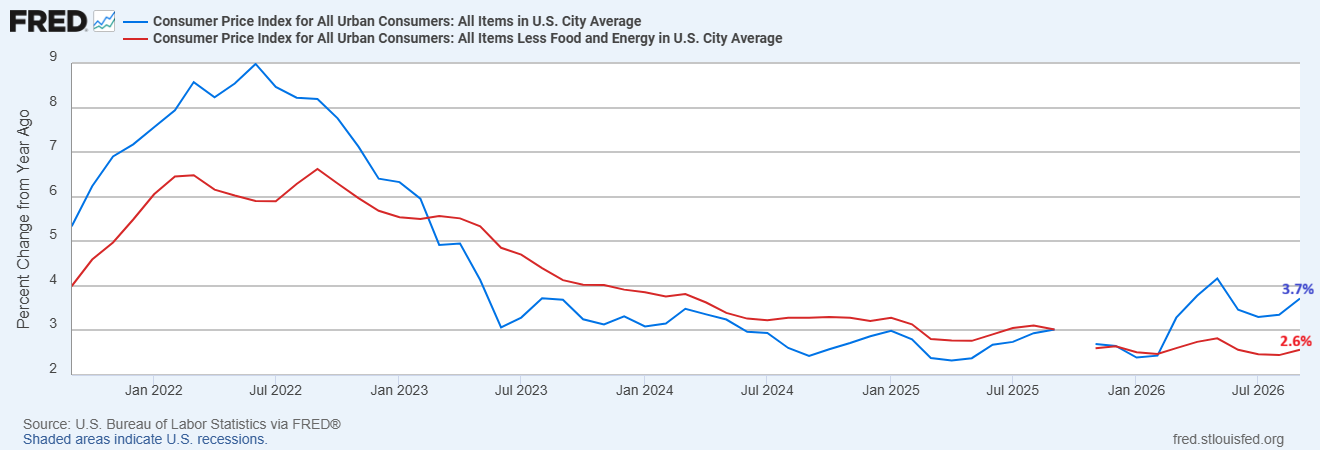
US inflation has created another challenge for the recovery in gold. Consumer prices increased 0.6% in September and lifted annual inflation to 3.7% from 3.4%. The gasoline price jumped 9.1% and accounted for more than half the monthly increase.
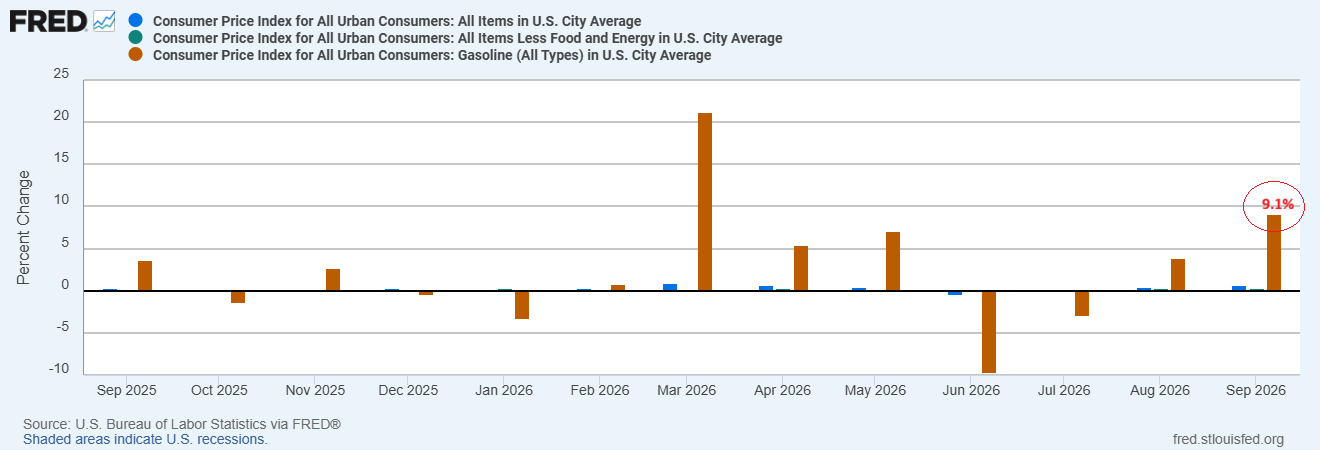
But the price pressure extended beyond energy. The core CPI increased 0.3% during the month, while the annual rate increased to 2.6% from 2.4%. These figures keep further tightening by the Fed in focus, even if oil prices ease.
However, the market did not maintain the first reaction to the CPI report. The 10-year US Treasury yields initially jumped to 5.33% and then reversed to 5.19%. The US dollar index also eased towards 101.87 on Thursday.
The cautious comments from Fed officials helped markets to reduce their expectations for a hike in October. The weakness in the US dollar and US Treasury yields on Thursday supported the rebound in gold after forming a low at $4,073. This suggests that inflation remains a concern, but the CPI data has not convinced markets that the Fed must act this month.
Gold Price Forecast
Every new Gold analysis as it publishes, today's technical signal and key levels, live price — on one page.
See all Gold forecastsReal Yields and US Debt Pressure Challenge Gold’s Recovery
The next test for gold is whether real yields also correct lower. These yields reflect bond returns after allowing for expected inflation. The high real yields increase the cost of owning gold. The low oil prices could ease inflation pressure and reduce the need for further tightening.
But the drop in inflation expectations alone would not guarantee relief for gold if nominal bond yields remain elevated. The chart below shows that the real yield crossed the breakeven inflation rate in July 2026 and remains well above the inflation rate.
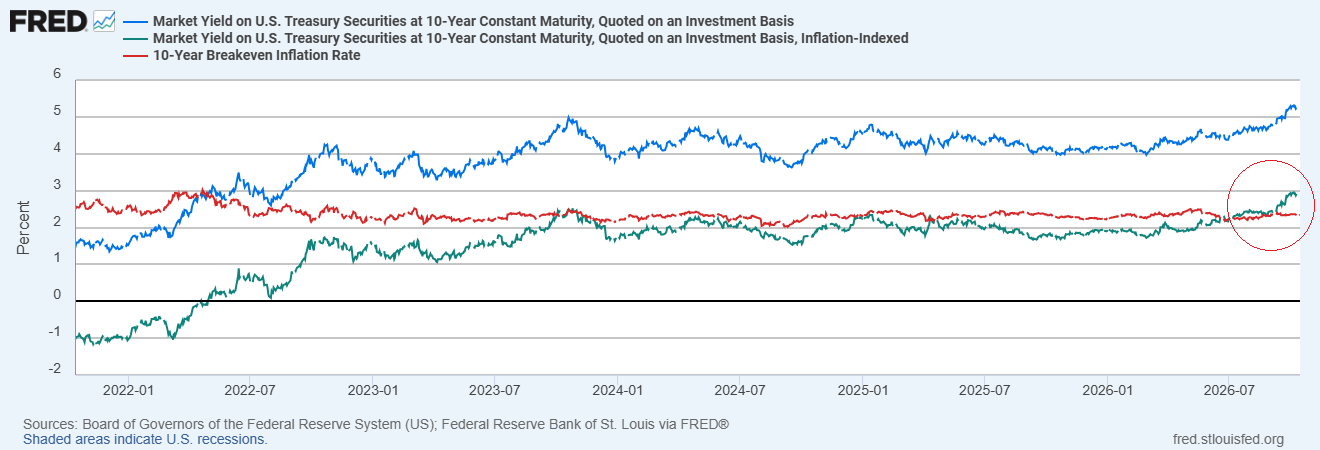
Government borrowing provides another source of pressure. The US Treasury projected $628 billion of net borrowing in August for Q4 2026. The heavy issuance can keep the yield elevated if investors demand higher returns to absorb the supply.
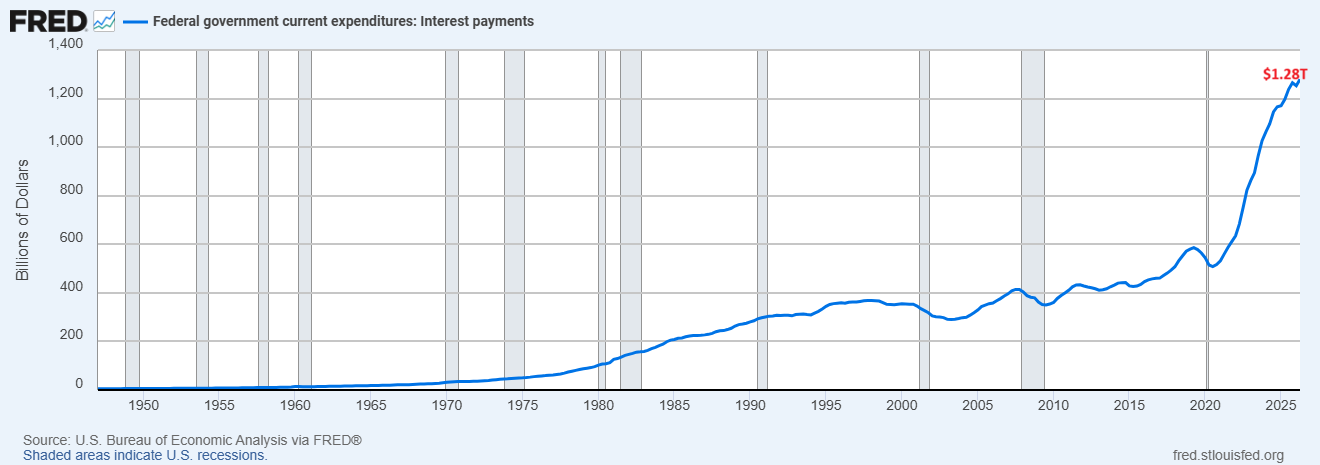
The high interest payments also put pressure on the federal budget. The chart below shows that federal interest payments are running at annualized rate of about $1.28 trillion in Q2 2026. These costs can increase borrowing needs in the future. This financing pressure keeps real yields elevated and limits the recovery in gold.
Fed Balance Sheet and US Data Shape the Gold Outlook
The balance sheet of the Fed provides a different part of the picture. The chart below shows the modest recovery in total assets and Treasury holdings while mortgage-backed securities continue to decline. This pattern does not support a claim that broad Fed balance sheet contraction has resumed.
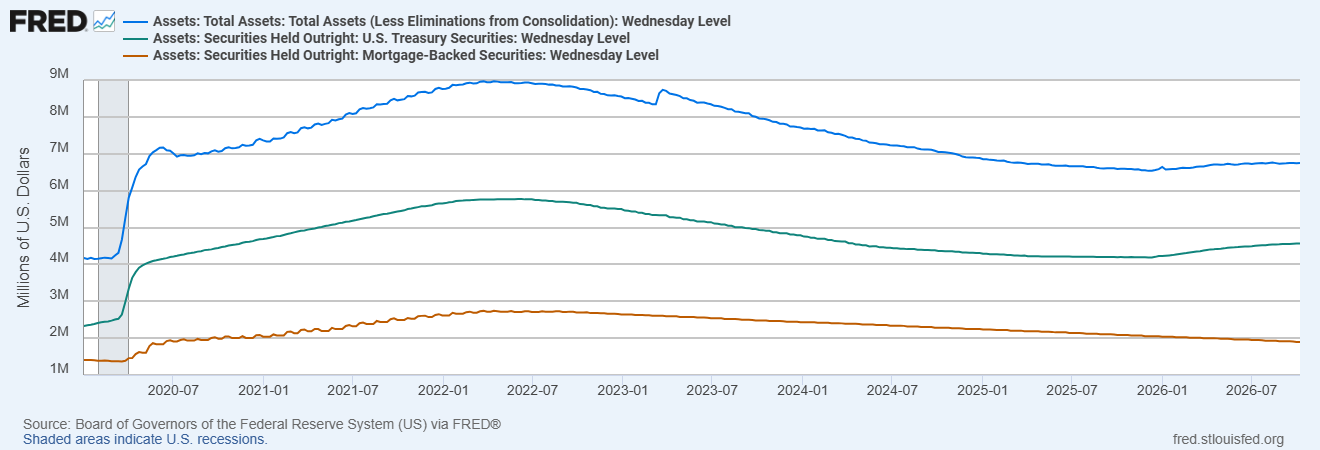
The Treasury bill purchases by the Fed help to maintain ample bank reserves. Their purpose differs from purchases designed to lower the cost of borrowing in the long term. The growing Fed balance sheet alone does not suggest that the monetary policy has become more supportive of gold.
In my view, the recovery in gold would look stronger if the US dollar and real yields continue to drop. The persistent inflation could still limit that recovery by keeping further rate increases in play.
The next test for the gold price is the US producer prices and retail sales data that will be released on Thursday. The strong data could revive expectations for the Fed tightening. But the soft data could give the Fed more room to wait and give gold more room to recover.
Gold Technical Analysis: $4,200 Resistance and $3,900 Support
Daily Chart: Falling Wedge Puts $4,200 in Focus
From a technical perspective, the gold price dropped after the CPI data release to mark a low at $4,073.54 and rebounded towards $4,150 on Thursday. The price action over the past two weeks suggests that the price is trading within the falling wedge pattern that stretches from 28 August 2026.
The support of this wedge remains near $4,000, while resistance remains at $4,200. A break above $4,200 this time will likely initiate a strong and quick rally towards the resistance of this wedge pattern near the $4,400 to $4,500 region.
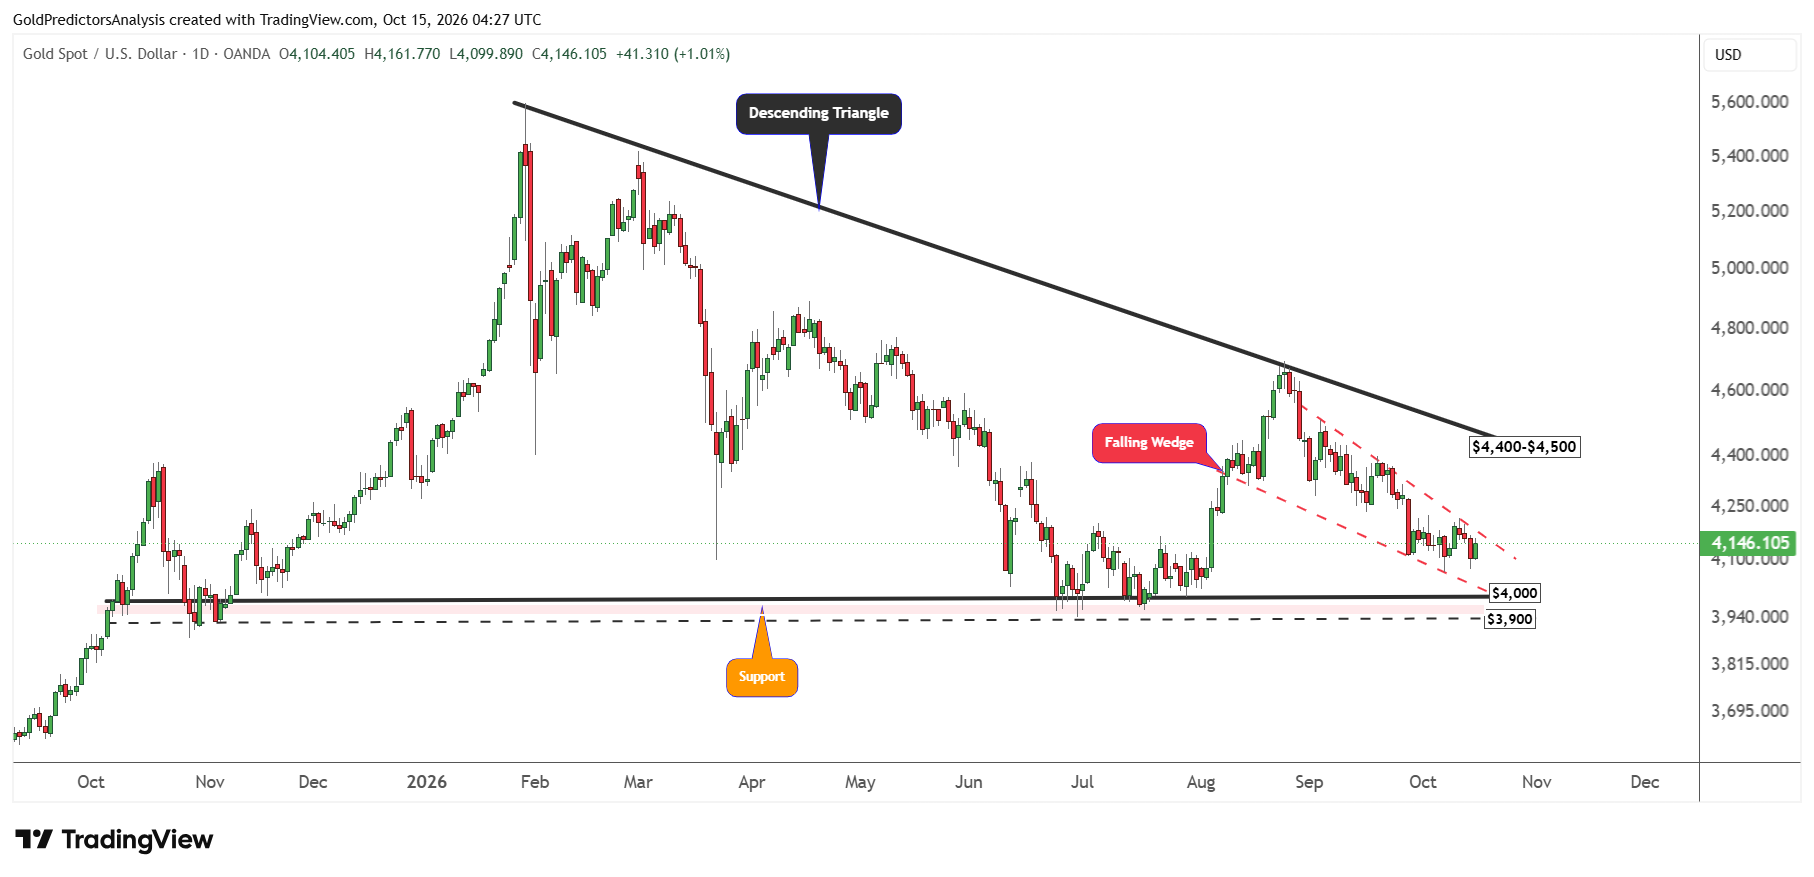
This resistance zone is also defined by the descending trend line of the triangle pattern that is key in the gold market at the moment. A break above $4,500 will likely break the descending triangle and open the way for a strong rally towards the $5,000 region.
On the other hand, if the gold price continues to drop, then the $3,900 to $4,000 region remains the major support zone. A break below $3,900 will likely break the descending triangle pattern to the downside and initiate a stronger drop towards the $3,500 to $3,600 region.
Weekly Chart: $3,950 Marks Key Downside Support
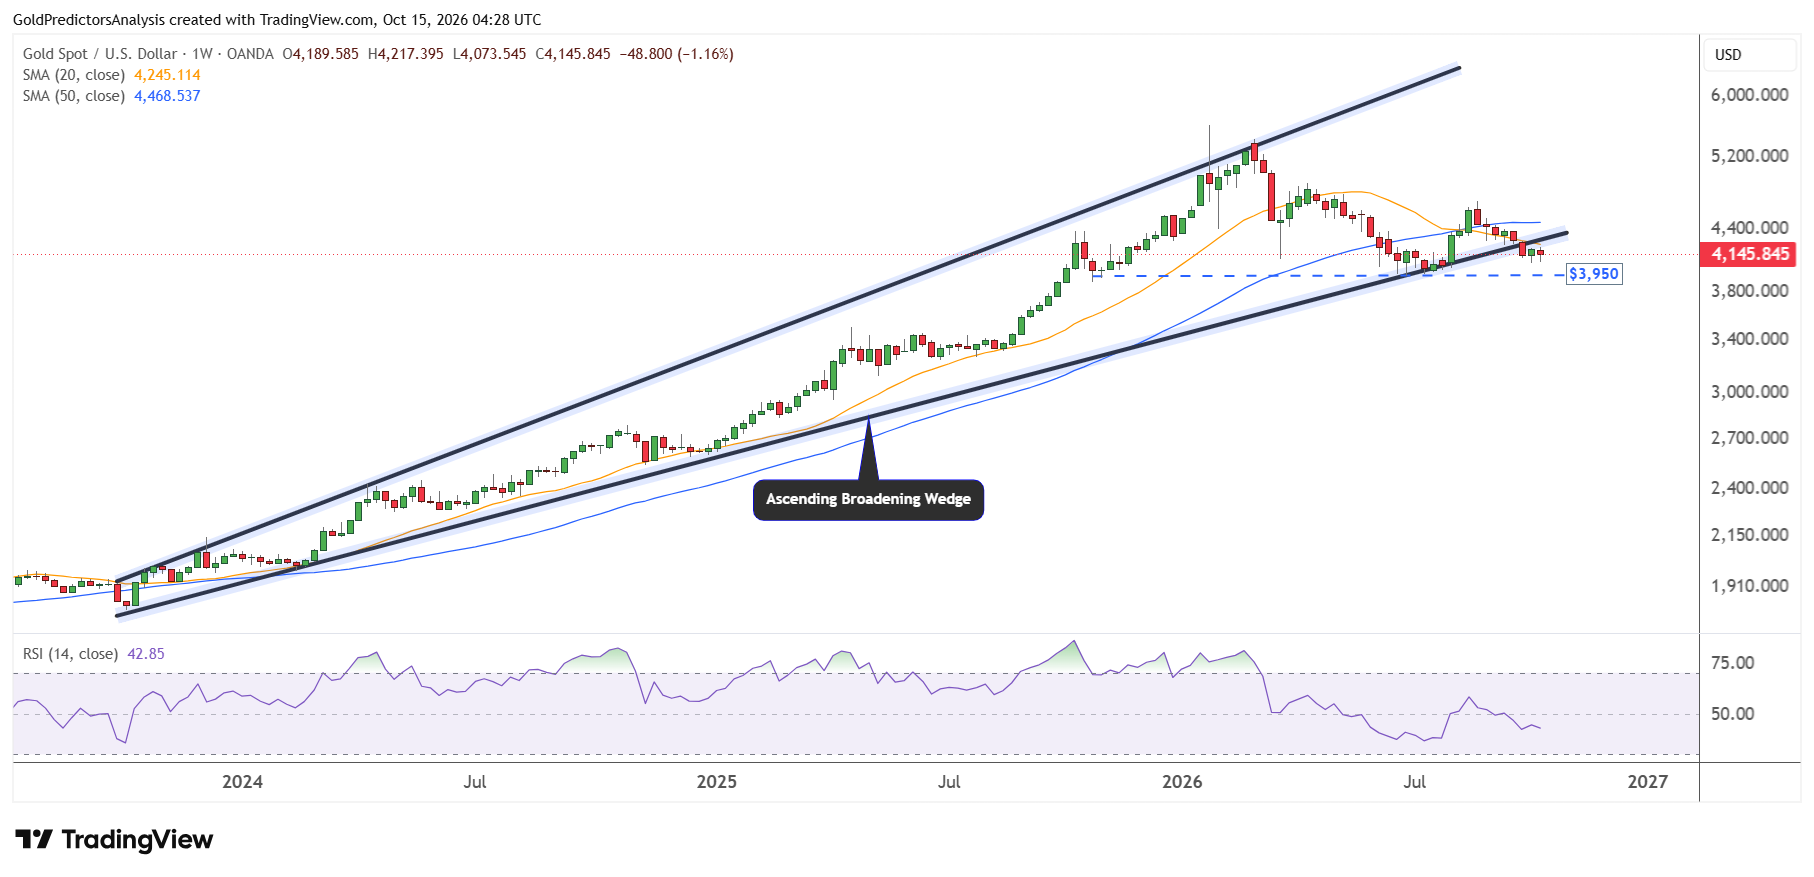
The important support in the gold market is also observed on the weekly chart, which shows that the price has already broken the ascending broadening wedge pattern. However, due to the heavy volatility, the price must also break $3,950 to trigger a stronger drop.
The 20-week SMA remains below the 50-week SMA, and the price is consolidating in the short term. If the price successfully recovers above $4,500, it will likely indicate that the bottom has formed within the ascending broadening wedge, and prices will likely rally higher.
But a break below $3,950 will support a deeper correction. The RSI remains below the midline, which suggests uncertainty in the gold market.
Monthly Chart: Gold Tests the $3,600–$4,100 Support Zone
Despite the uncertainty in the gold market in the short term, the long-term price structure for gold remains constructive. The recent correction in gold is due to profit-taking from the key resistance area in the gold market.
This resistance is defined by the ascending channel pattern. The price is now consolidating within the major support zone in gold, which remains between $3,600 and $4,100. This zone is shown in green, marked on the monthly chart below.
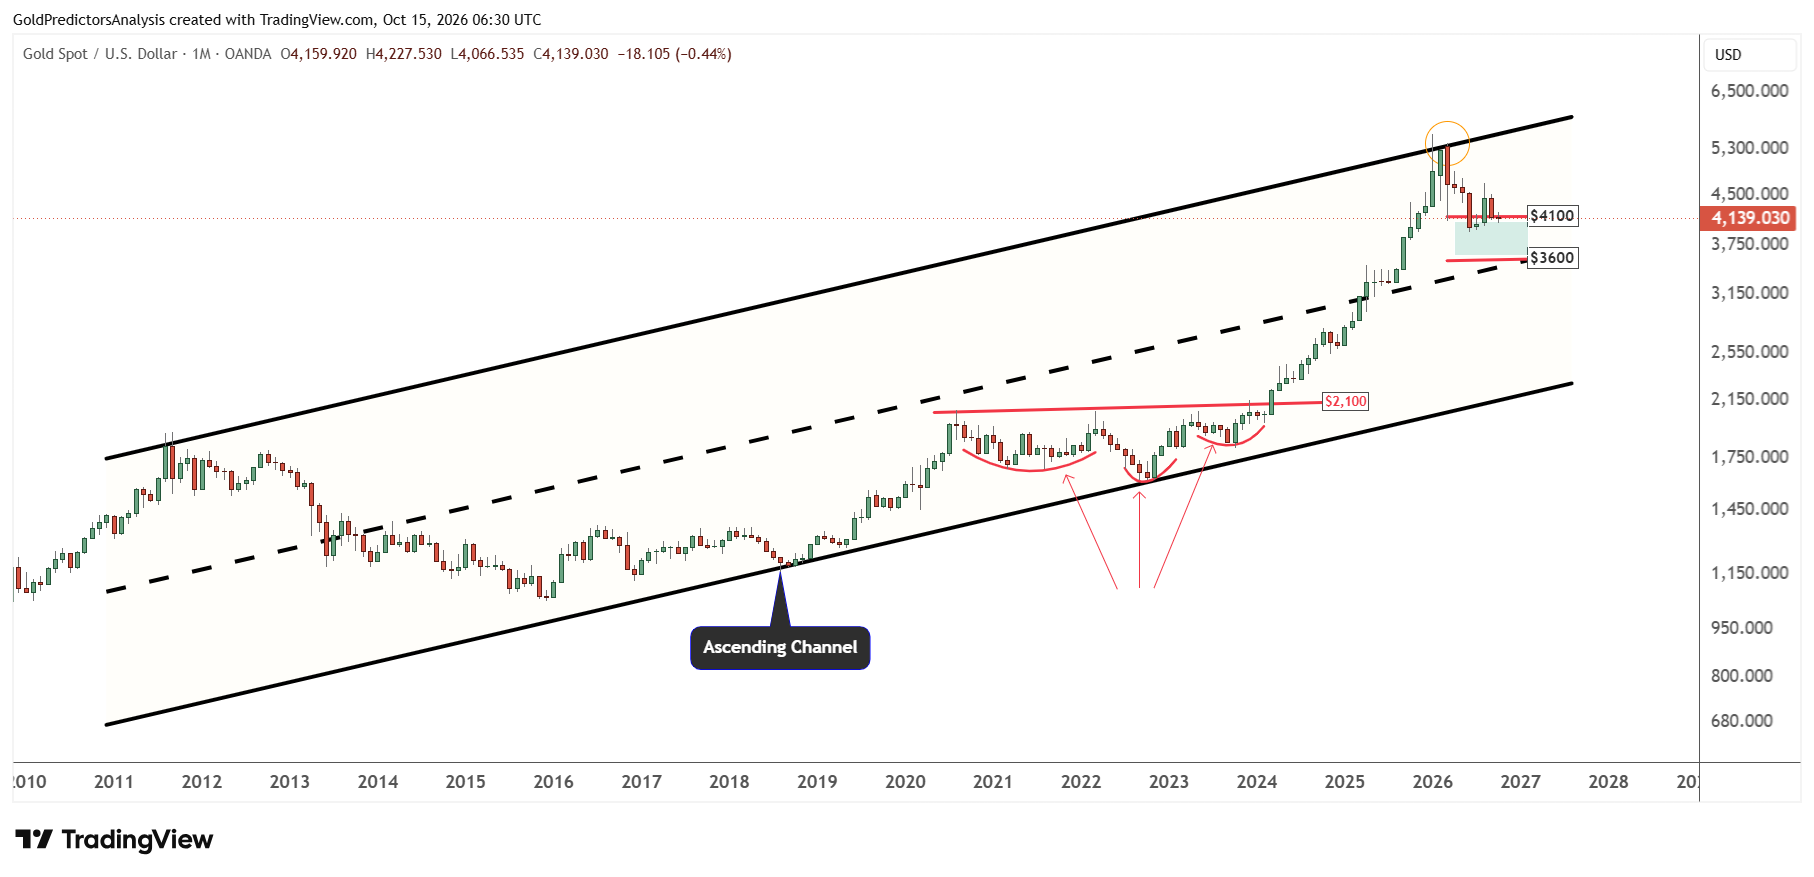
The price lost 6.57% in September after the peak in August at $4,697. This suggests negative price action in the short term and indicates that prices may consolidate further to find the next move.
A break below the $3,900 region will open the way for a further drop towards the $3,600 area. The formation of an inverted head and shoulders pattern from August 2020 to March 2024 suggests constructive price action in the long term. Therefore, this correction will likely be important for long-term investors.
What to Watch Next
The US producer prices and retail sales will provide the next test for gold. The soft readings could ease expectations for a Fed hike and support the rebound in gold. But the strong data could revive concerns about further tightening by the Fed. In my view, a continued decline in the dollar and real yields would give gold more room to recover. But the persistent inflation and heavy government borrowing could still limit gains in gold.
Traders may watch the $4,200 level in the short term for the first sign of a stronger recovery. A break above this level could open the way towards $4,400-$4,500. Gold would need to clear $4,500 to bring $5,000 back into focus. On the downside, a break below $3,950 would increase pressure on $3,900. A break below $3,900 will increase the risk of a deeper correction to $3,600. The broader structure remains constructive, but the rebound still needs confirmation at $4,200.
Read more: China’s Solar Slowdown Threatens Demand for Silver