


Silver (XAG) prices rebounded on Friday, but a strong US dollar and concerns of persistent inflation continue to limit the recovery. The upcoming US CPI report could shape expectations for a rate hike in December and drive the next move in the dollar, Treasury yields and silver. The weak performance of silver relative to gold also calls for caution. In my view, a correction in the US dollar and a clear break above $65 in spot silver would strengthen the rebound. This article presents the key drivers, the outlook for the US dollar and key technical levels to understand the next move in silver prices.
Silver Fundamentals: US CPI and Fed Hike Risks Shape the Outlook
Fed Hike Risks Support the Dollar and Limit Silver’s Rebound
Silver rebounded above $60 an ounce on Friday as the correction in the US dollar and the US Treasury yields eased pressure on the metal. Oil prices also remain uncertain as President Trump said that the US would avoid attacks on Iran before the elections in November. This offered some relief from concerns of energy inflation. But the Brent oil later finished near $107.23 a barrel. This indicates that the costs of energy still remain a risk to inflation and the recovery in silver.
The prospect of further tightening by the Fed continues to support the dollar. The US dollar index remained near 102.2 on Friday after several weeks of gains. Fed Governor Christopher Waller said on Thursday that he expects an additional increase in interest rates if economic data develop as anticipated.
He also said that the increases need not come at consecutive meetings. Therefore, a pause in October would leave further hikes in focus. The higher US interest rates can support the dollar and keep the rallies in silver limited.
US CPI and Inflation Expectations Set the Next Test
The University of Michigan survey on Friday added further uncertainty to the market. The chart below shows that the preliminary consumer sentiment dropped to 46.3 in October from 48.1 in September.
Silver Price Forecast
Every new Silver analysis as it publishes, today's technical signal and key levels, live price — on one page.
See all Silver forecasts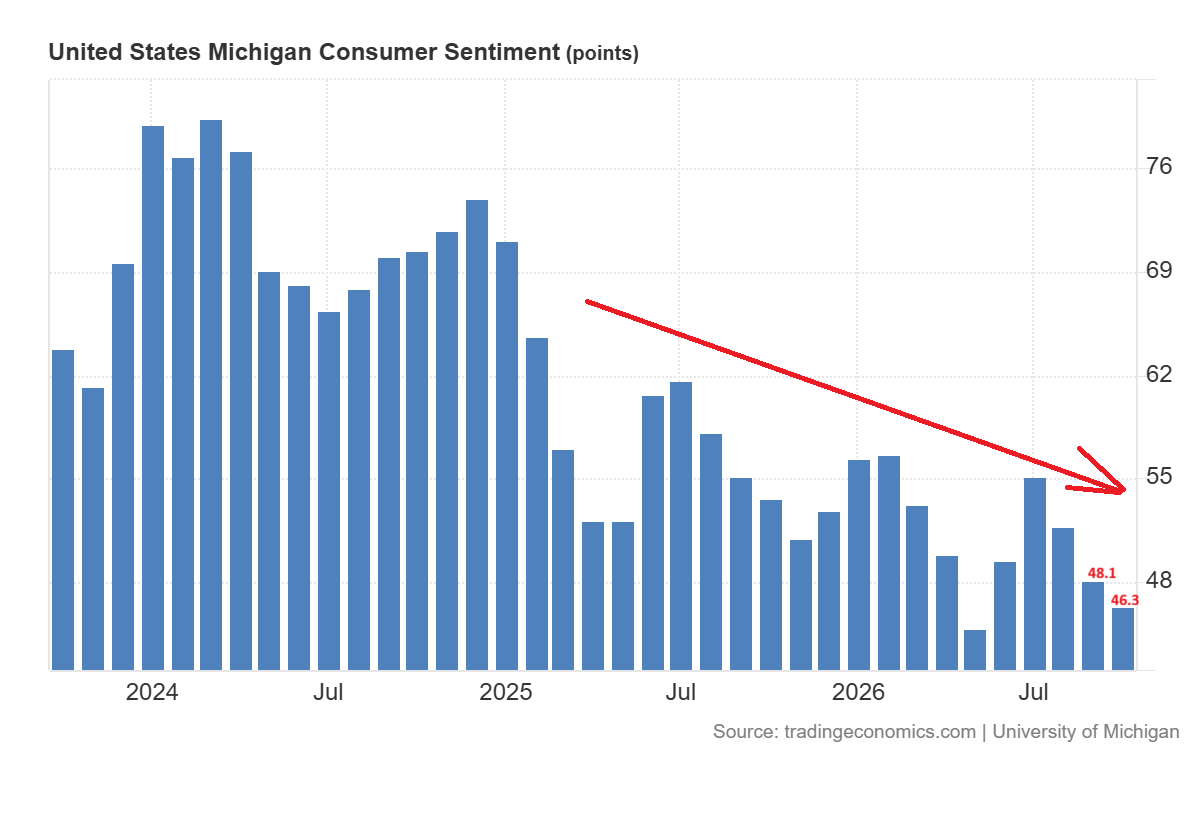
Meanwhile, one-year inflation expectations increased to 4.7% from 4.6%. The consumers reported weaker buying conditions for durable goods due to high prices and costs for borrowing. This combination could complicate the next Fed’s decision.
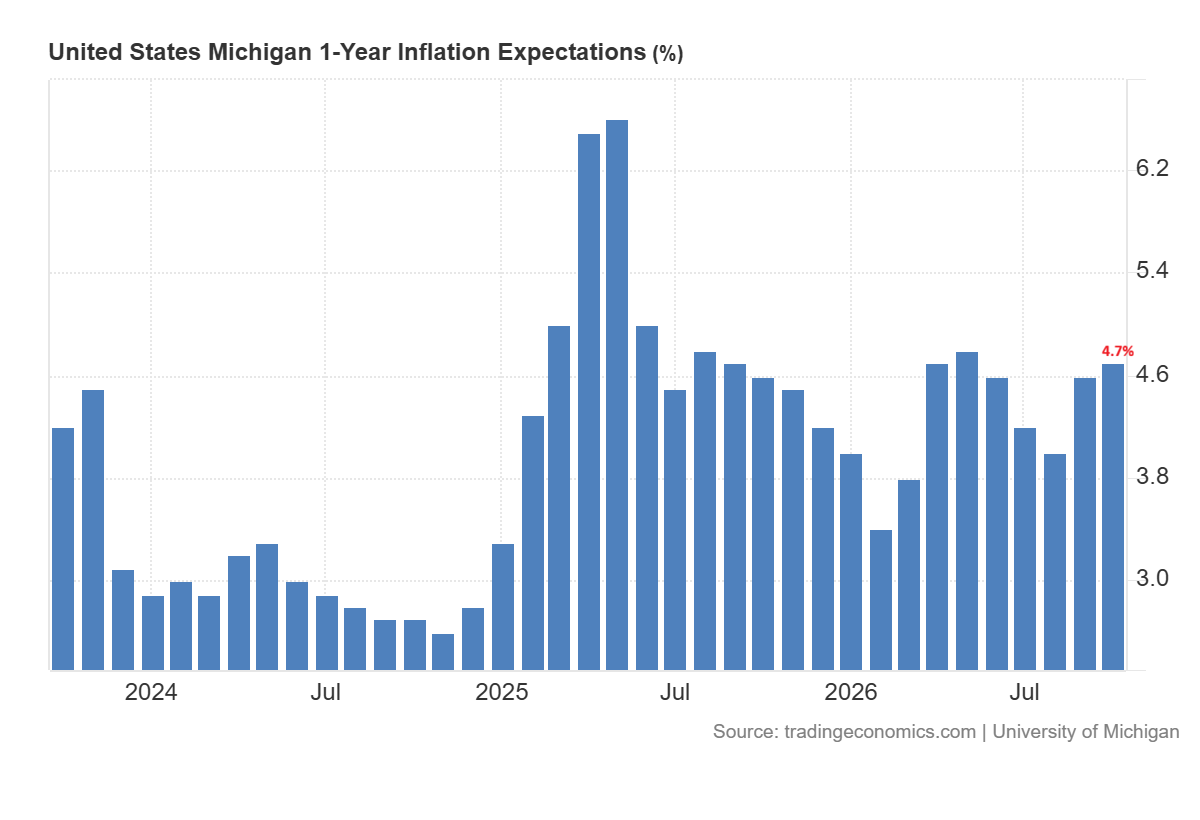
The weak confidence calls for caution, but rising inflation expectations could keep pressure on officials to tighten the policy. For silver, that leaves the risk of renewed strength in the dollar despite signs of strain among consumers.
The US CPI report for September is due on Wednesday, 14 October. This data is the next major catalyst. A stronger reading could reinforce expectations for a rate hike in December. That could further lift the US dollar and Treasury yields and put fresh pressure on silver prices.
A softer reading could reduce those expectations and give the metal more room to recover. In my view, a softer US dollar and lower real yields would provide stronger support for the rebound in silver. The response to the CPI will help indicate whether the rally on Friday can continue further.
US Dollar Index Forecast: 102.50 Breakout Could Target 104
Monthly and Weekly Charts Show Bullish Dollar Momentum
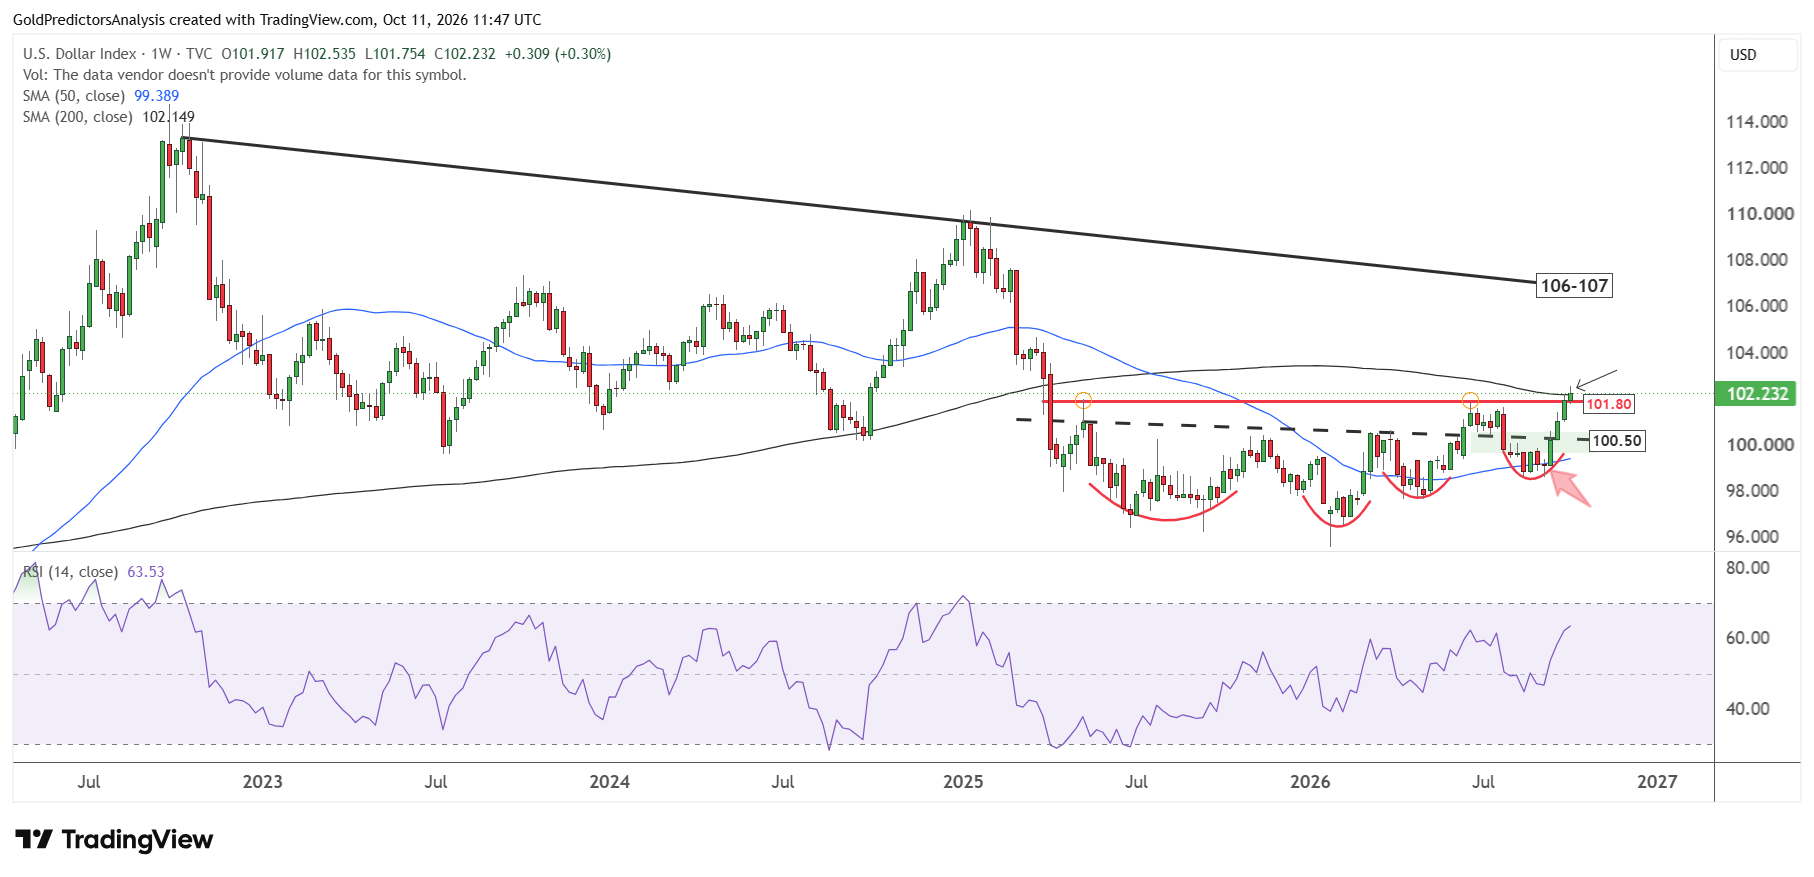
The US dollar index has come out of the strong consolidation over the past year and broken 100.50 and then 101.80. This breakout suggests continued positive momentum in the short term, with potential for further upside.
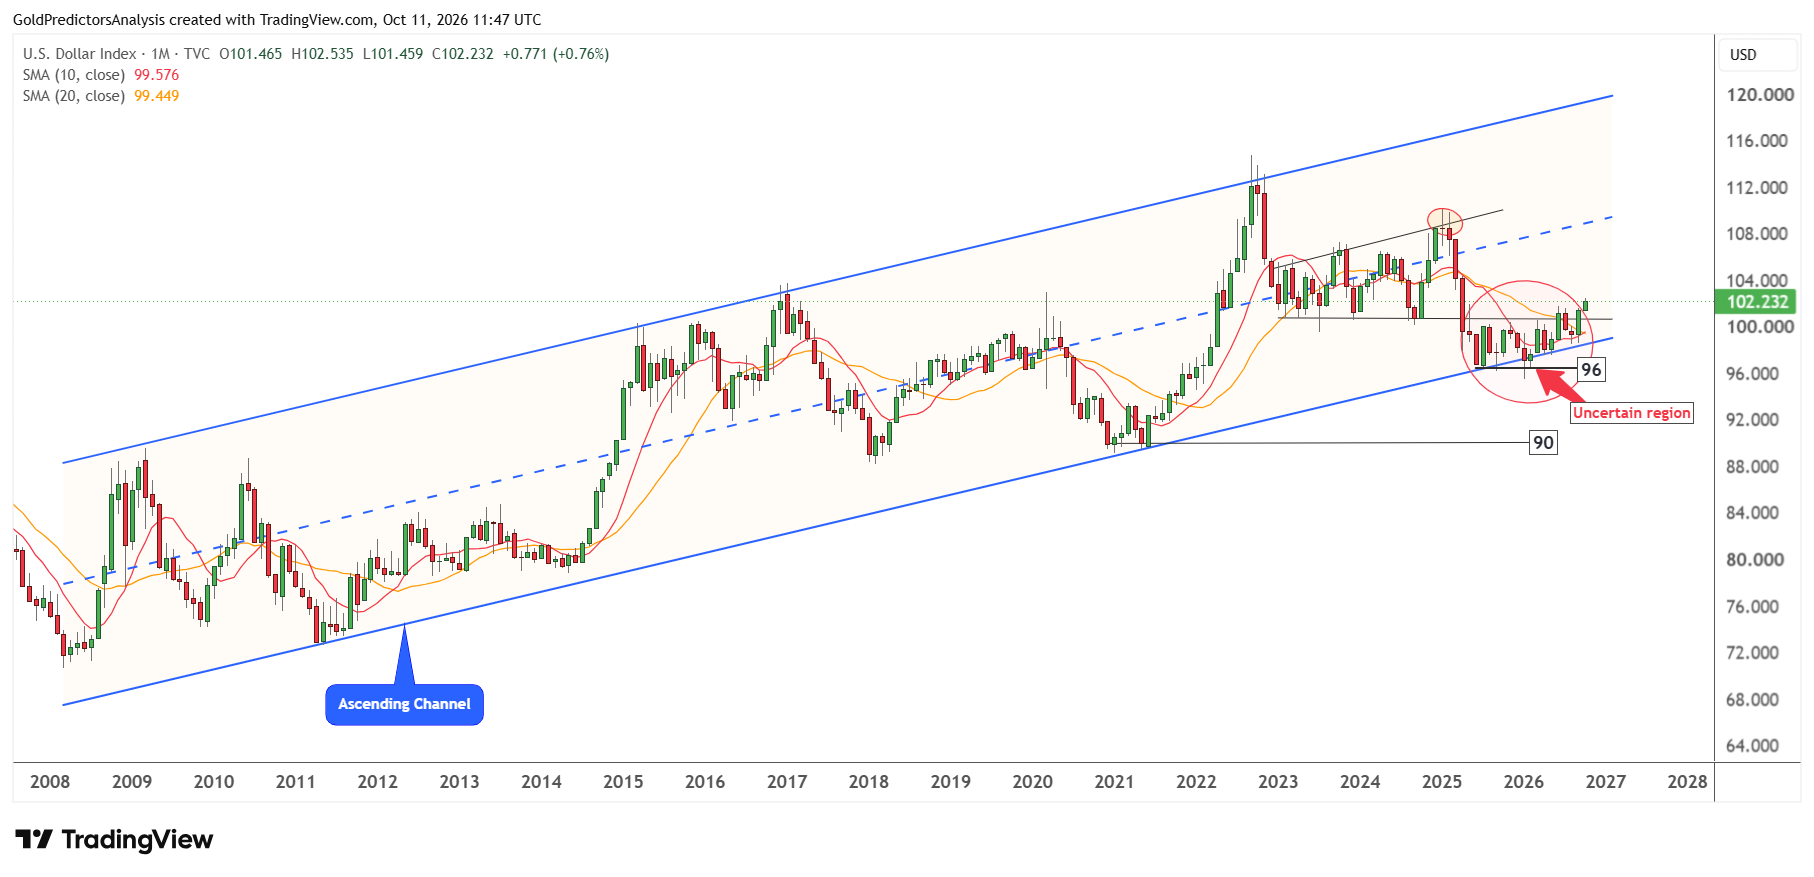
The monthly chart for the US dollar shows that the price had been consolidating above the support of the ascending channel over the past 15 months and then produced a strong bullish candle in September 2026 to close at 101.61. The continued upside move in October 206 suggests further gains.
This strong recovery in the US dollar is further highlighted in the weekly chart, which shows that the index has formed a rounding bottom pattern since June 2025. The index is now challenging the 200-week SMA near the 102 level. A clear break above this SMA will likely push the index towards the key resistance of the descending trend line at the 106-107 level. This descending trend line stretches from the September 2022 highs.
Dollar Breakout Above 102.50 Could Pressure Silver
The short-term price action in the US dollar also remains strongly bullish, as the index has formed a double bottom pattern, with the first low formed on 20 August 2026 at 98.55 and the second low formed on 10 September 2026 at 98.59. After forming this double bottom pattern, the index has broken above 99.60, triggering a strong rally to 102.50.
The index is now forming a strong compression pattern within a triangle below 102.50. Therefore, a break above 102.50 will likely trigger another strong rally towards the 104 area in the short term.
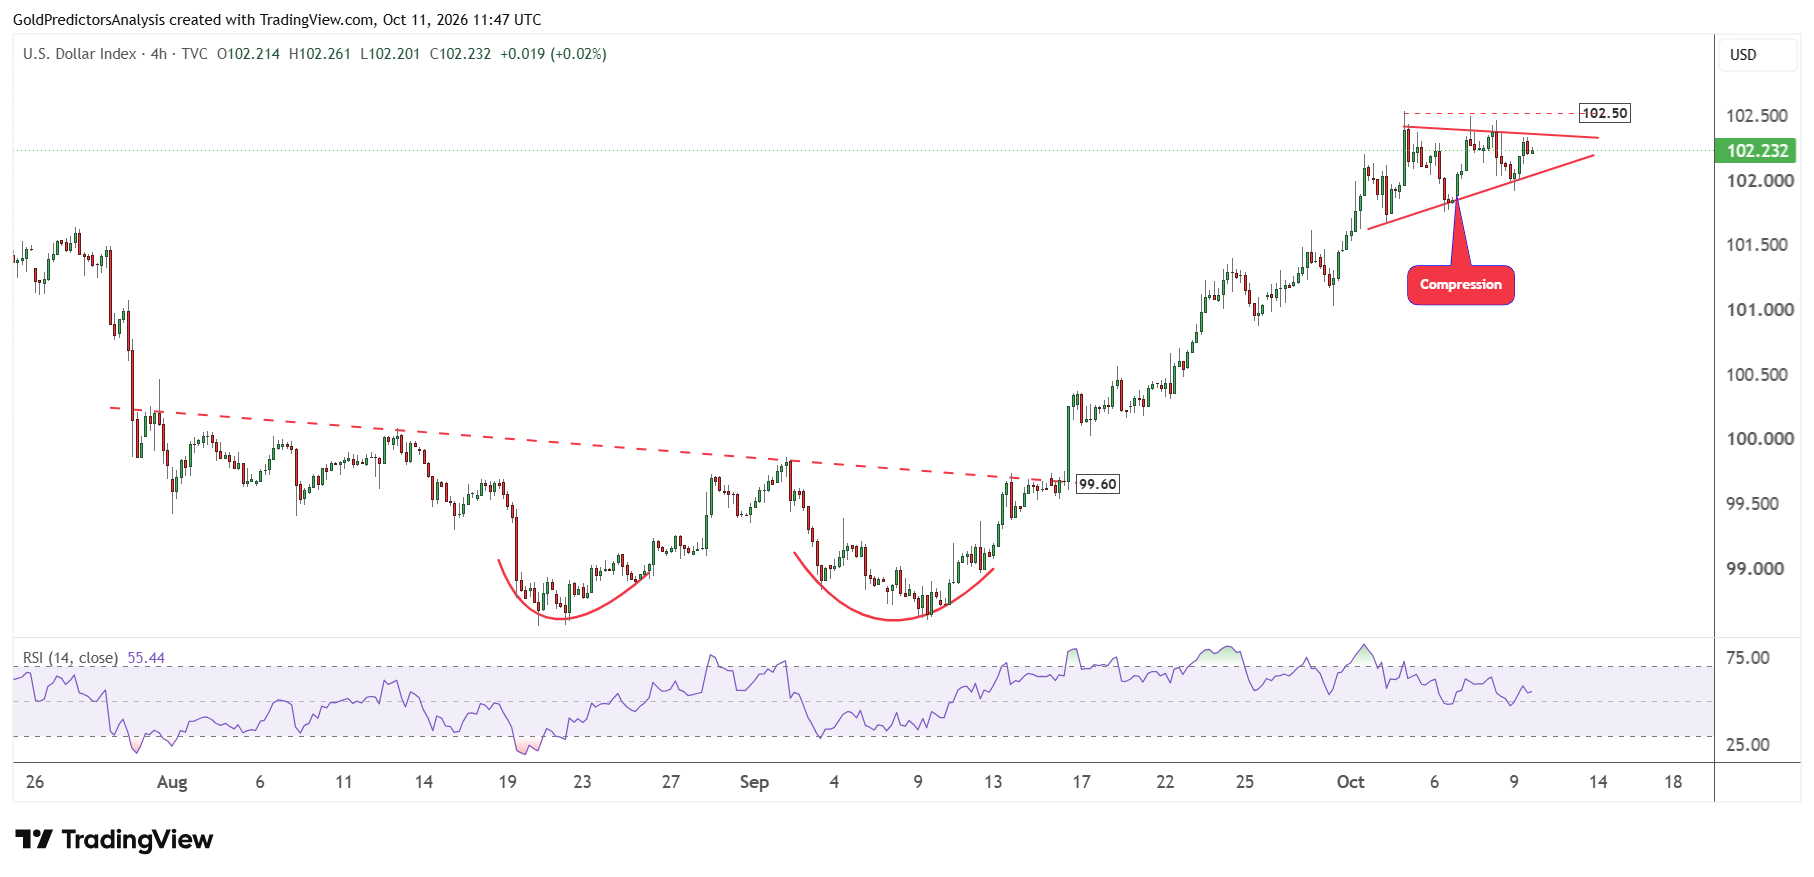
This bullish price action in the US dollar index suggests that silver may remain under pressure, or any rallies in the silver price may be limited.
Despite the gains in the US dollar index, silver prices rebounded last week from the low at 58.50 to close at 60.82. However, the price must break the $65 to confirm a meaningful recovery.
Silver Price Forecast: $65 Resistance and $50 Support in Focus
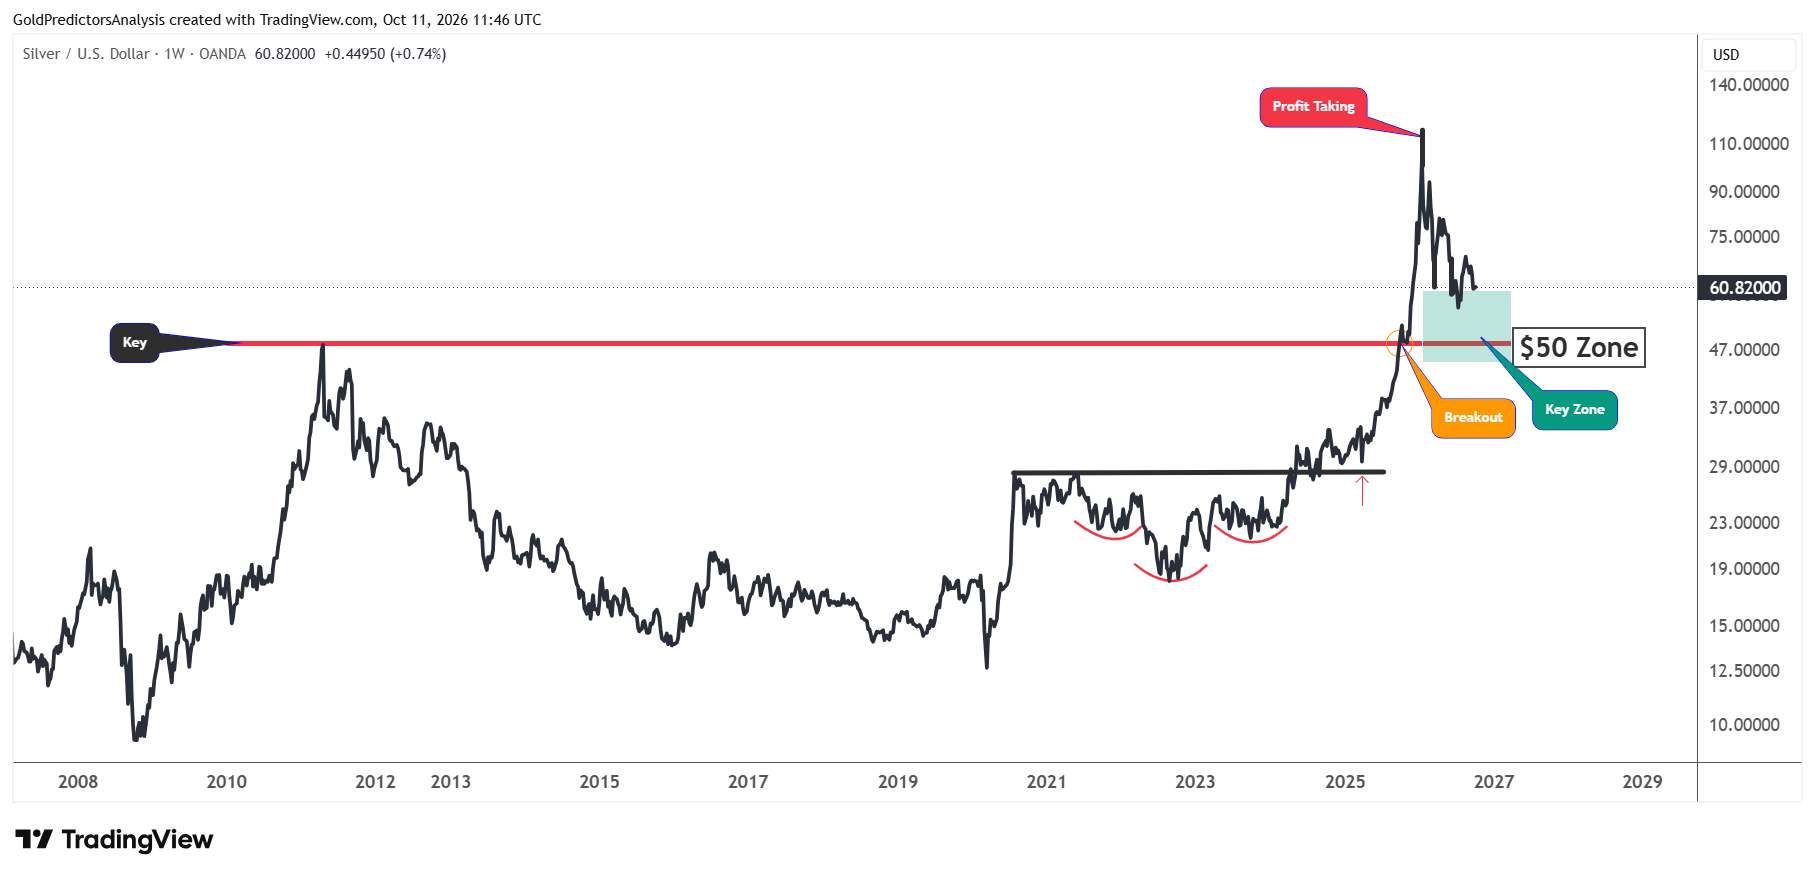
Silver prices have remained in a correction after reaching a record high in January 2026. The prices are now moving towards the long-term support zone, which lies between $45 and $55. This zone is marked in green and is considered a key support zone in the silver market.
The emergence of an inverted head and shoulders pattern from August 2020 to December 2024 and the breakout above the $50 area in October 2025 suggests a positive move. Therefore, a correction in silver prices is considered as strong support for long-term investors.
The chart below shows the formation of a falling wedge pattern from the January 2026 highs. The bearish hammer candle in the last week of August 2026 and the continued drop after this high suggest that silver prices remain under bearish pressure in the short term.
The prices must break above the $65 area in the short term to suggest a move towards $72. However, only a break above $72 will confirm a bottom and initiate a rally towards the $90 region.
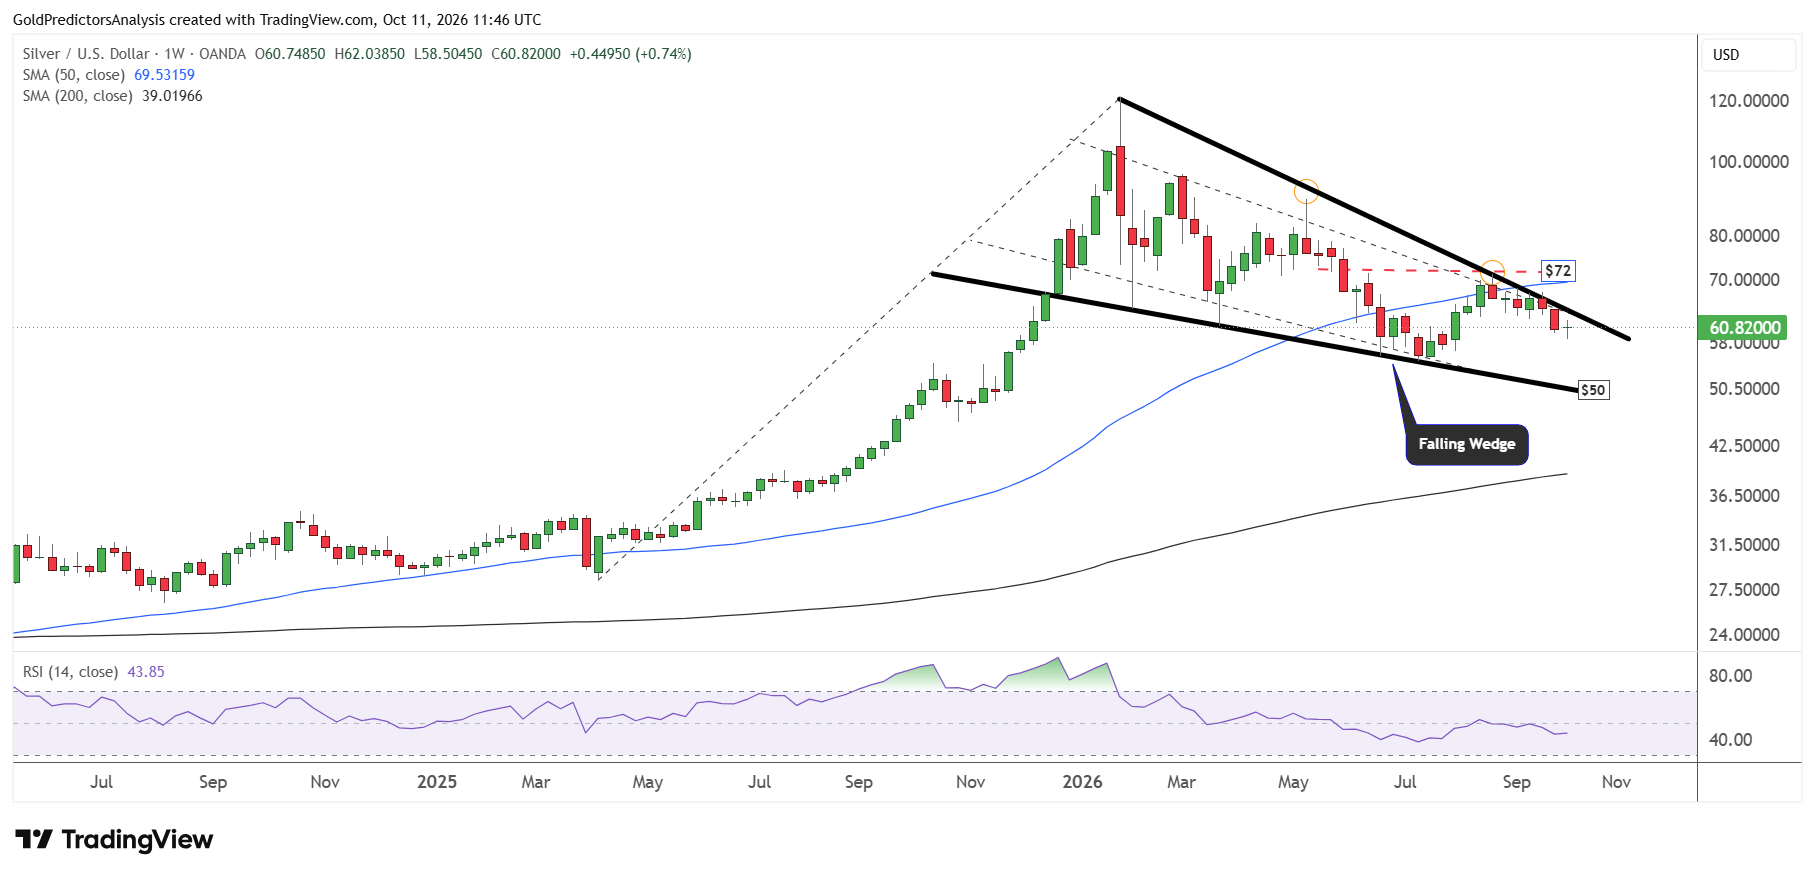
The current price action and the formation of a falling wedge pattern suggest that if the prices fail to break above the $65 level, they may continue to drop towards the lower boundary of the falling wedge pattern at around the $50 area. This drop towards $50 may be supported by a strong rally in the US dollar index, as discussed in the above section.
Silver-to-Gold Ratio: 0.0154 Marks the Recovery Test
The monthly chart below shows that the ratio of silver to gold (XAU) broke above the descending trend line in late 2025 after forming rounded bases. The rally then reached 0.02302 in 2026 and corrected back to the breakout area. Another rally in the ratio peaked at 0.01886 in May 2026 and produced a correction.
This correction from May 2026 suggests that the relative momentum in silver has weakened. The ratio now trades near 0.01450, which is below the key resistance at 0.0154. This suggests that silver has lost some of earlier strength against gold.
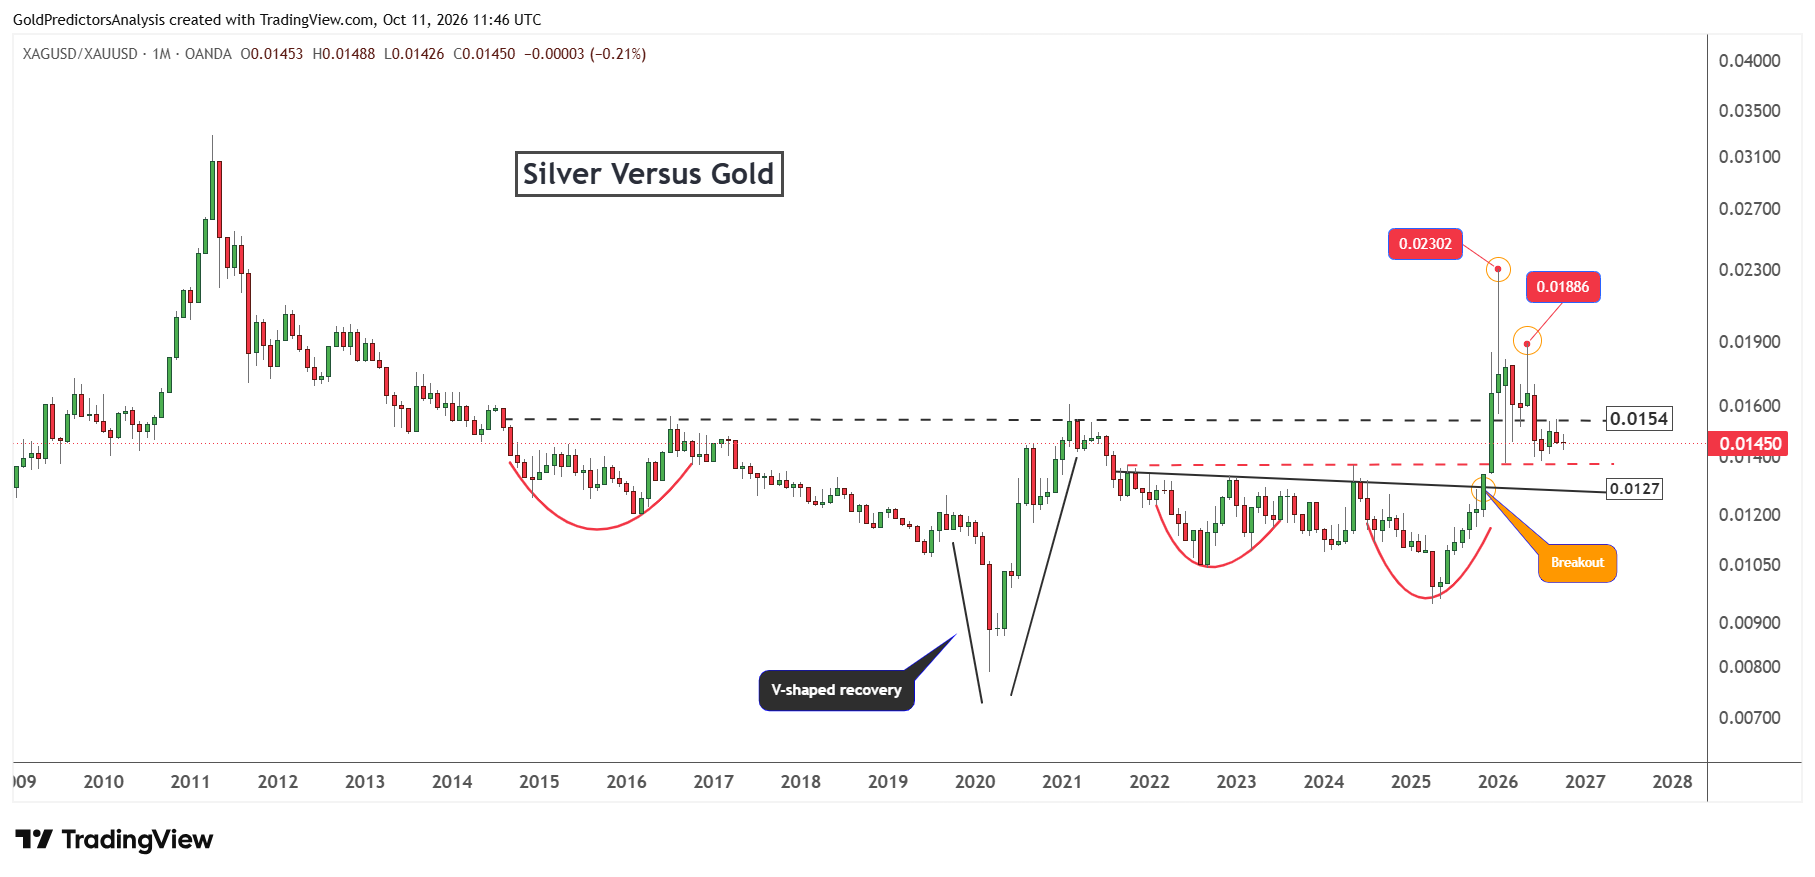
A clear break above 0.0154 would indicate renewed strength in silver relative to gold. That strength in the ratio could bring 0.01886 back into focus, followed by 0.02302 if the recovery continues. But the failure to break above the 0.0154 level may introduce further downside toward the 0.0127.
A break below 0.0127 would weaken the broader recovery and suggest further underperformance by silver. The overall structure for the ratio remains positive after the V-shaped recovery in 2020 and the rounded base formation in 2022 and 2025. In my view, the broader structure for the ratio remains positive. But it needs to regain 0.0154 to indicate renewed strength in silver against gold.
What to Watch Next
The US CPI report on 14 October will provide the next major test for silver. The strong inflation data could increase the expectations for a rate hike in December and lift the US dollar and Treasury yields. This would put fresh pressure on the current rebound in silver. But a softer reading could ease that pressure and support further gains in silver. The US dollar index also needs close attention, as a break above 102.50 could limit the recovery in silver.
For silver, $65 remains the first resistance. A clear break above this level would bring $72 into focus. A further break above $72 could open the way towards $90. However, the failure to clear $65 would leave a test of the $50 area possible. The ratio of silver to gold also needs to regain 0.0154 to show renewed relative strength. In my view, a soft US dollar and a clear break above $65 would support the bullish outlook in the short term.
Read more: Softer Dollar Fuels Rebound in Gold and Silver Despite Fed Hike Risks