
Advertisement
Advertisement
Buying the bear? Equity demand endured market pain: Mike Dolan
By:
By Mike Dolan LONDON (Reuters) - It's a hard habit to break.
By Mike Dolan
LONDON (Reuters) – It’s a hard habit to break.
You’d be forgiven for thinking the worst two-quarter period for stock markets since 2009 had investors running for the hills – but you’d be wrong.
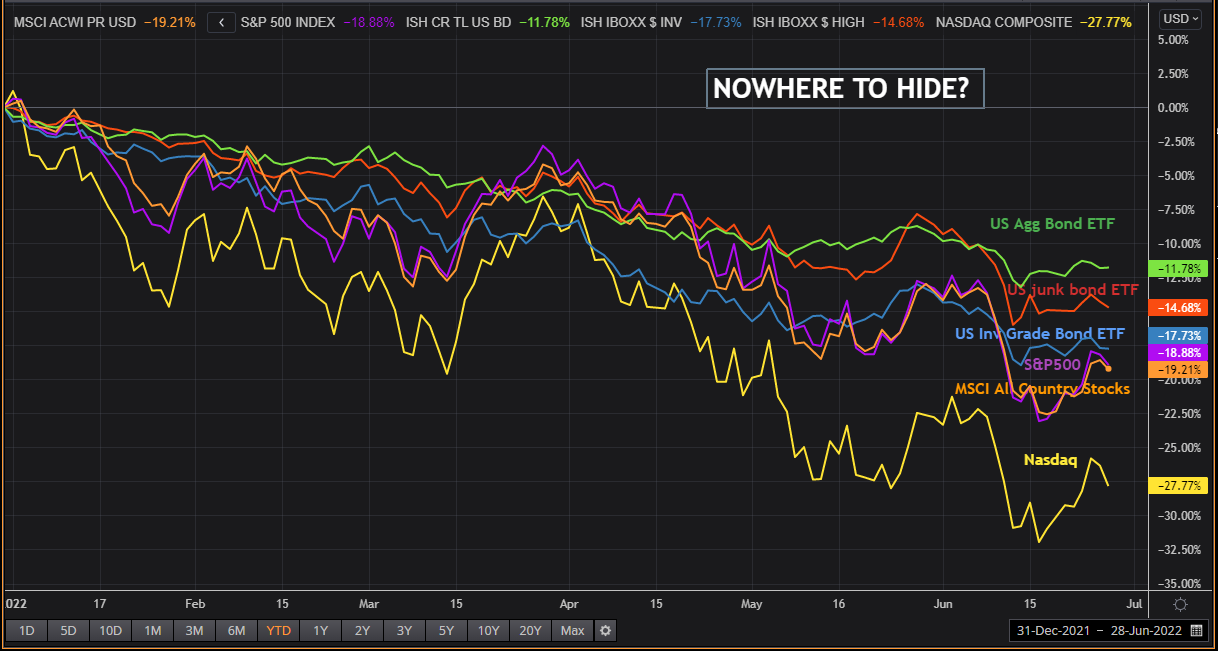
One of the most startling statistics from the torrid first half of 2022 is that investors bought a net $195 billion of stocks even as major U.S. and global equity indices lost almost a fifth of their value in the face of rising inflation, interest rates and recession fears.
According mutual fund data tracked by Bank of America, the big “capitulation” to date all came in bonds as fixed income funds saw a net $193 billion head for exits in the year through June 22.
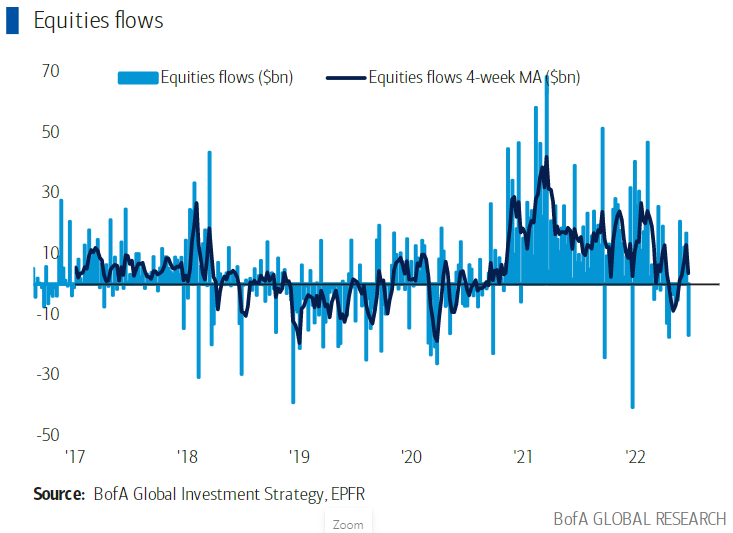
At first glance, it looks like investors bought the considerable dip – wisely or not. Closer inspection shows the demand was heavily frontloaded in the year and waned over the past three months.
But the persistent demand for stocks amid serial political and economic shocks has surprised many nonetheless.
For many, it was just for want of an alternative, as inflation and rate rises whacked cash and bonds returns hard.
A belief that stocks perform better in periods of high inflation was perhaps part of it. And correlated losses in both stocks and bonds undermined the latter’s traditional hedge in balanced portfolios and likely stoked heavy overweighting of equity.
What’s clear from the same set of fund stats is that the net buying was all in passive Exchange Traded Funds, which attracted a $320 billion – while so-called “long-only” funds saw net outflows to the tune of $126 billion.
A big question now is whether the second half of the year sees asset allocation flipped as recession worries replace inflation as the dominant narrative and the search for peak interest rates rebalances the savings mix back to bonds.
If so, that “capitulation” in bonds and cash in the first half may just switch to equities as earnings forecasts finally reflect the slowdown ahead.
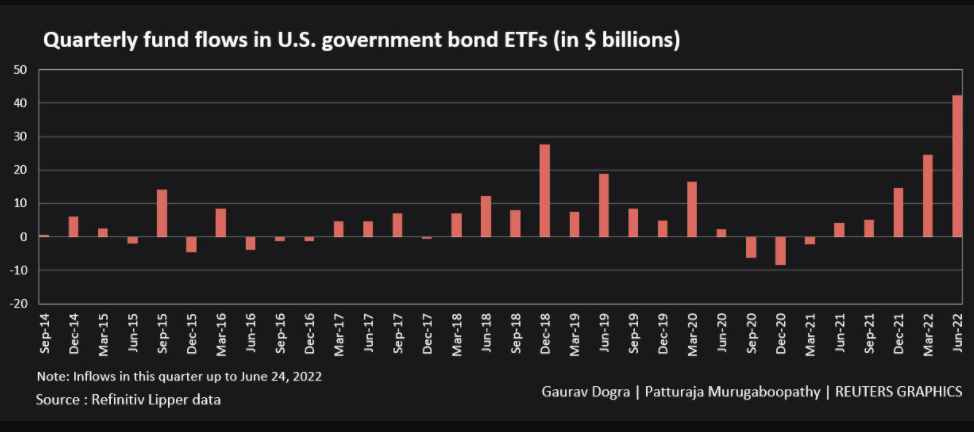
According to Refinitiv Lipper data, U.S. government bond ETFs are already on course to receive the biggest quarterly inflow in eight years.
Higher bond yields certainly make expected returns on traditional 60/40 equity/bond portfolios more attractive for long-term investors and will put pressure to reduce extreme equity skews.
What’s more, Schroders strategists point out that the risk reduction provided by 60/40 funds comes mostly from the lower volatility of bonds rather than their negative correlation per se – with equity portfolios twice as volatile historically.
“Bond volatility and/or correlations would need to rise materially in order to erode the risk-reward ratio of the 60/40 compared to holding equities only,” they concluded.
Householdings
So will investors overloaded with equity and heavily underwater eventually bail out?
Focusing on the U.S. equity market, Goldman Sachs points out the “surprisingly strong” demand this year from households – who both directly or indirectly via funds own some 75% or almost $60 trillion of the U.S. market.
Although it tailed off during the past three months, Goldman strategists showed these investors held 47% of their financial assets in equity at the start of the second quarter – near the peak of what they held at the top of the dot.com bubble in 2000 and 95th percentile since 1990.
This level of exposure may appear ripe for rebalancing as falling real incomes, economic nerves and better returns in bonds see a preference for less volatile holdings.
But while overall household equity exposure has slipped back to about 44% of assets since April, Goldman cautioned about expecting a sharp acceleration of the selling.
The main reason it cites is that the top 10% of the wealthiest U.S. households holds an “astounding” 89% of that combined household equity position – and high inflation makes little or no difference to their income of wealth.
What’s more, Goldman estimates that this 10% also owns some $12 trillion of the $18 trillion of cash currently held by households and past behaviour shows they may even switch some of this to equity over the coming quarters.
Of course time is also something wealthier investors can afford. And buying now after a 20% drawdown may make sense as markets try to sniff out a peak in interest rates on the horizon.
That said, buying now is no guarantee of a bounce by year-end – as the first half of the year showed.
Unigestion portfolio manager Salman Baig reckons bear markets historically only bottom on average some 35% below from the peaks and there may be some way to go yet – alongside a very nervy wait for hawkish central banks to draw in their talons.
“If central banks, in particular the Fed, remain knee-deep in their fight against inflation, the environment will become toxic for equities,” said Baig.
The author is editor-at-large for finance and markets at Reuters News. Any views expressed here are his own
(by Mike Dolan, Twitter: @reutersMikeD; editing by David Evans)
About the Author
Reuterscontributor
Reuters, the news and media division of Thomson Reuters, is the world’s largest international multimedia news provider reaching more than one billion people every day. Reuters provides trusted business, financial, national, and international news to professionals via Thomson Reuters desktops, the world's media organizations, and directly to consumers at Reuters.com and via Reuters TV. Learn more about Thomson Reuters products:
Did you find this article useful?
Latest news and analysis


Advertisement