
Advertisement
Advertisement
Slumping U.S. stock market technical indicators flash warning sign
By:
By Saqib Iqbal Ahmed NEW YORK (Reuters) - Indicators that investors use to gauge the health of the U.S. stock market have taken a turn for the worse, fueling worries that the benchmark index may revisit its mid-June bear market low.
By Saqib Iqbal Ahmed
NEW YORK (Reuters) – Indicators that investors use to gauge the health of the U.S. stock market have taken a turn for the worse, fueling worries that the benchmark index may revisit its mid-June bear market low.
The S&P 500 is down 7% since mid-August following a sharp summer rally, battered by expectations that the Federal Reserve will raise rates higher than previously anticipated in its fight to bring down consumer prices from their 40-year highs.
The retreat in stocks has given more reason for caution to those who track market phenomena such as breadth, momentum and trading patterns to inform their investment decisions. While many of these indicators were painting an optimistic picture just a few weeks ago, they tell a less bullish story now, raising worries that this year’s selloff in markets may not be over.
“I had to downgrade the market technically, given how severe the decline has been over the last three weeks,” said John Kolovos, chief technical strategist at Macro Risk Advisors.
“The odds of a market bottom being struck back in June have diminished to that of just slightly better than a flip of a coin at this juncture.”
Among the factors investors study is market breadth, which shows whether a significant amount of stocks are rising or falling in unison. Positive market breadth, when more stocks are advancing than declining, points to a high degree of confidence among stock bulls.
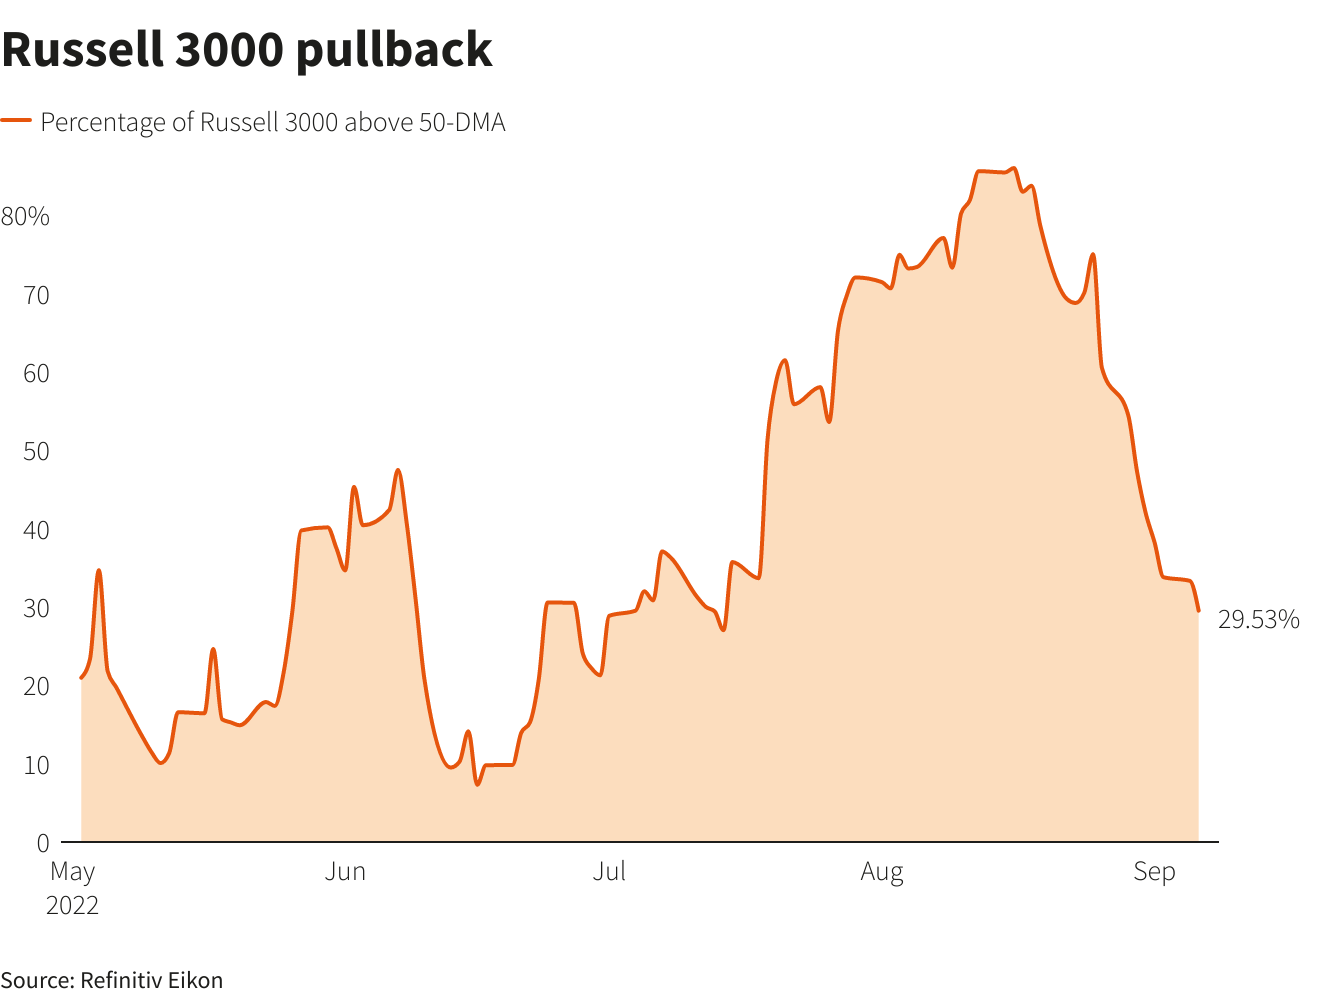
Recently, market breadth has started to send worrying signals. The percentage of stocks trading above their 50-day moving average in the Russell 3000 has fallen to about 30%, from around 86% in mid-August.
“We want to see this indicator stabilize where it is right around now,” Kolovos said. “We really don’t want to see it get much lower than 25%.”
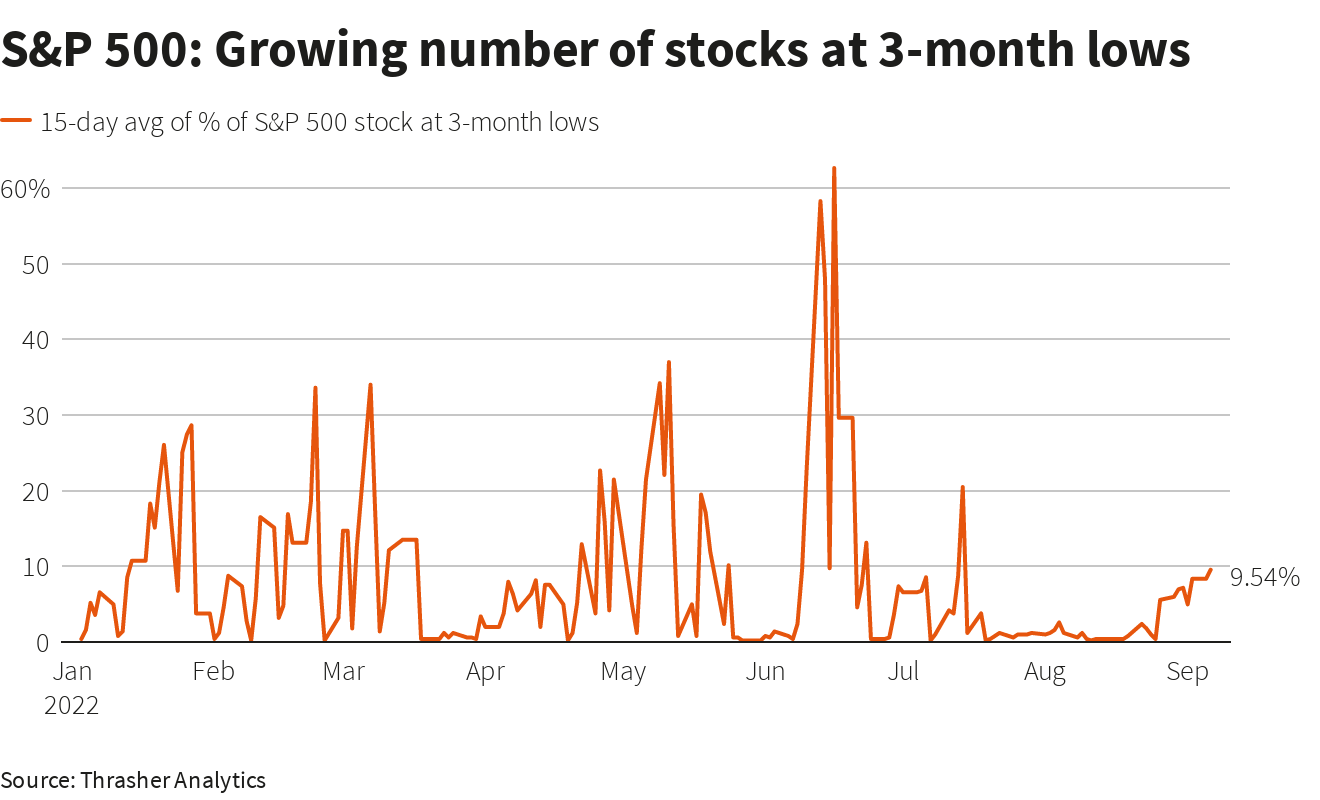
Meanwhile, the 15-day moving average of the percentage of S&P 500 stocks hitting fresh three-month lows – another measure of stock market breadth – has climbed to about 10% from just above zero in mid-August, according to data from Thrasher Analytics. It stood at around 60% during the market low in June.
“We’re watching if we continue to see an expansion in bearish breadth,” said Andrew Thrasher, the firm’s founder. “If we see expanding new lows that will put downside pressure on the index.”
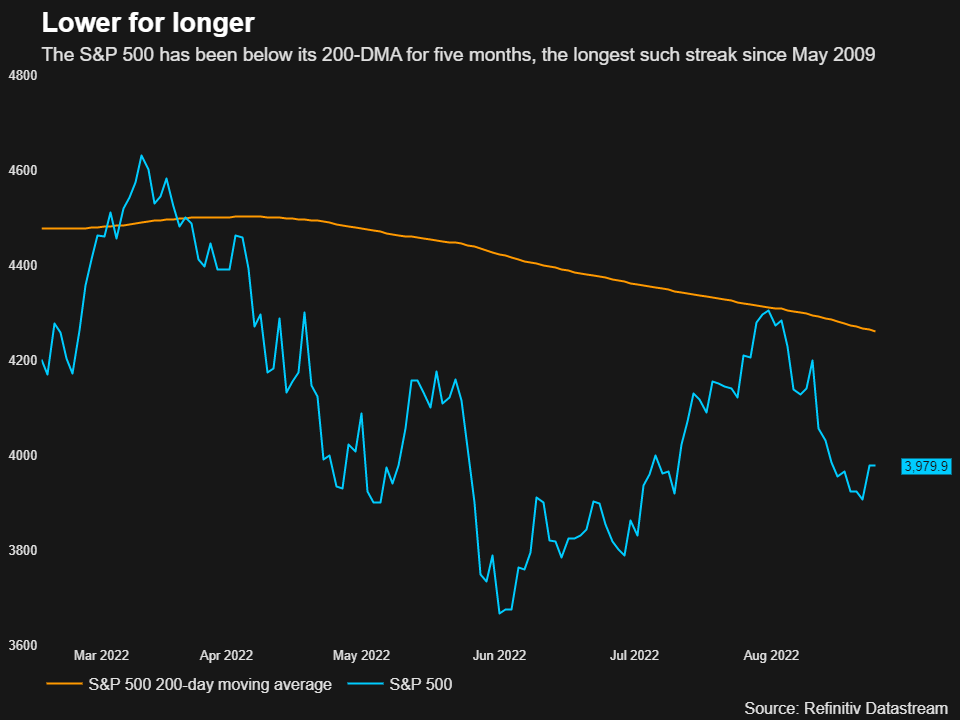
Additionally, the S&P 500 Index has lingered below its 200-day moving average for five months now, the longest such streak since May 2009.
Historically, the index has returned -3.56% in September when it is below the 200-day moving average during a year in which the United States holds midterm elections, as it will in 2022, according to BofA Global Research. The index is up around 1% month-to-date.
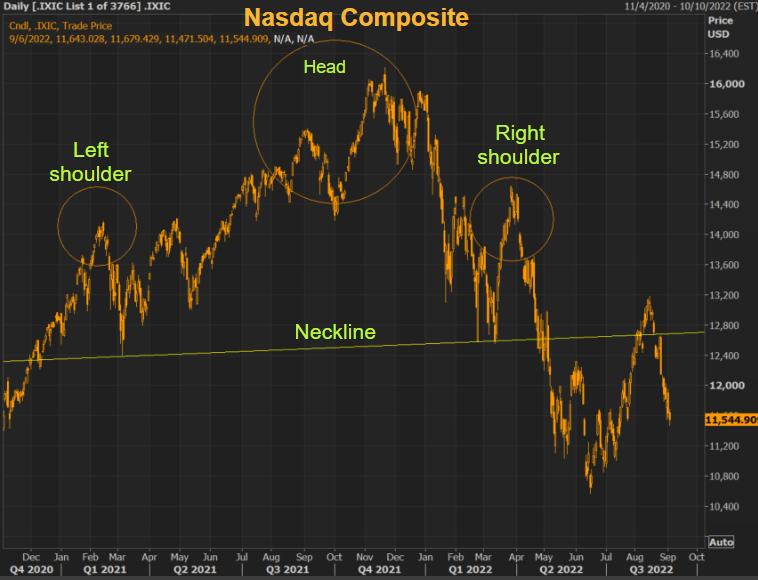
Tech stocks have been hit particularly hard in recent weeks, with the tech-heavy Nasdaq Composite down about 10% since mid-August.
Some chart-watchers see more trouble ahead for the index, which recently formed a bullish-to-bearish trend reversal known as a “head and shoulders top.”
The index already broke the so-called neckline of the head and shoulders formation earlier this year, a bearish development. A drop through its recent low of around 10,500 could open the Nasdaq up to a move to 8,800, ICAP analyst Brian LaRose said. The index closed on Thursday 11,862.
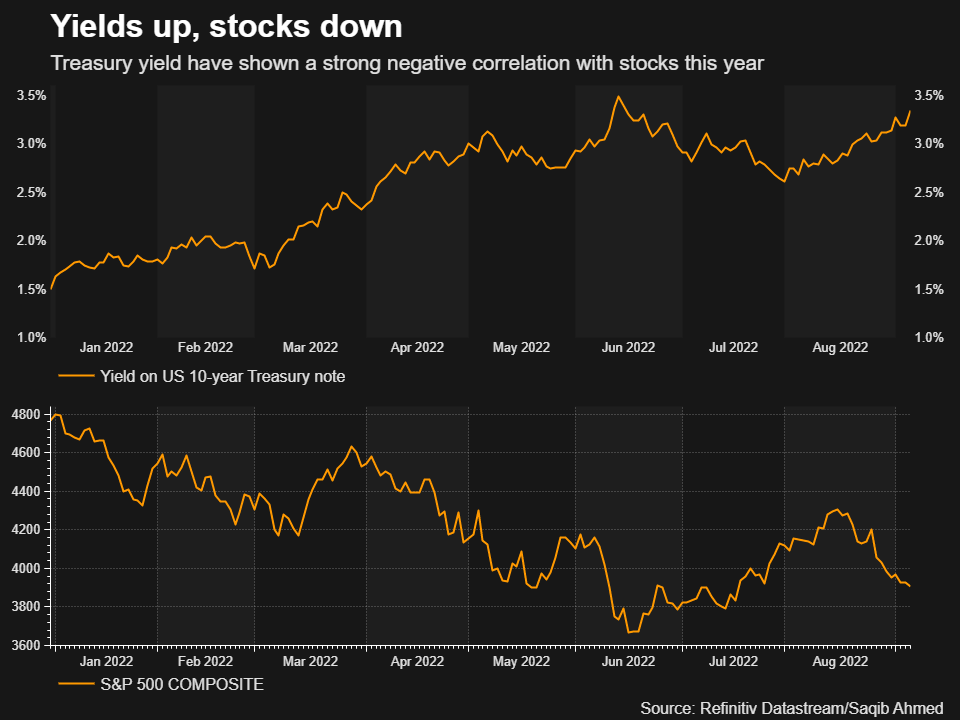
Of course, technicals can improve or worsen as markets gyrate and investors adjust expectations based on factors such as the trajectory of bond yields, which are driven by monetary policy expectations and have closely tracked the performance of stocks this year.
The yield on the benchmark 10-year Treasury hit a peak of nearly 3.5% on June 14, just before the S&P 500 hit its recent low.
While stocks rebounded as yields dipped over the summer, a recent bounce in yields has accompanied the downturn in equities this month, with the 10-year yield now around its highest level since June 16.
Meanwhile, real yields, which strip out inflation and are seen as a key driver of risk asset prices, earlier this week stood at 0.88%, near their highest level since 2019.
Yields have “huge implications for what could happen in the next few months,” said Mark Newton, technical strategist at Fundstrat. “My own my thinking is that yields are very close to a peak and should start to roll over.”
(Reporting by Saqib Iqbal Ahmed in New York; Editing by Ira Iosebashvili and Matthew Lewis)
About the Author
Reuterscontributor
Reuters, the news and media division of Thomson Reuters, is the world’s largest international multimedia news provider reaching more than one billion people every day. Reuters provides trusted business, financial, national, and international news to professionals via Thomson Reuters desktops, the world's media organizations, and directly to consumers at Reuters.com and via Reuters TV. Learn more about Thomson Reuters products:
Did you find this article useful?
Latest news and analysis


Advertisement