



However, the German Preliminary CPI m/m for May fell to 0.2% from 0.5%, indicating weaker inflationary pressures.
Events Ahead
Looking ahead, the focus will be on key U.S. economic indicators. The Richmond Manufacturing Index is forecasted at -6, an improvement from the previous -7. Fed officials, including FOMC Members Williams and Bostic, will be speaking later in the day.
Additionally, the release of the Beige Book will provide insights into U.S. economic conditions.
US Dollar Index (DXY)
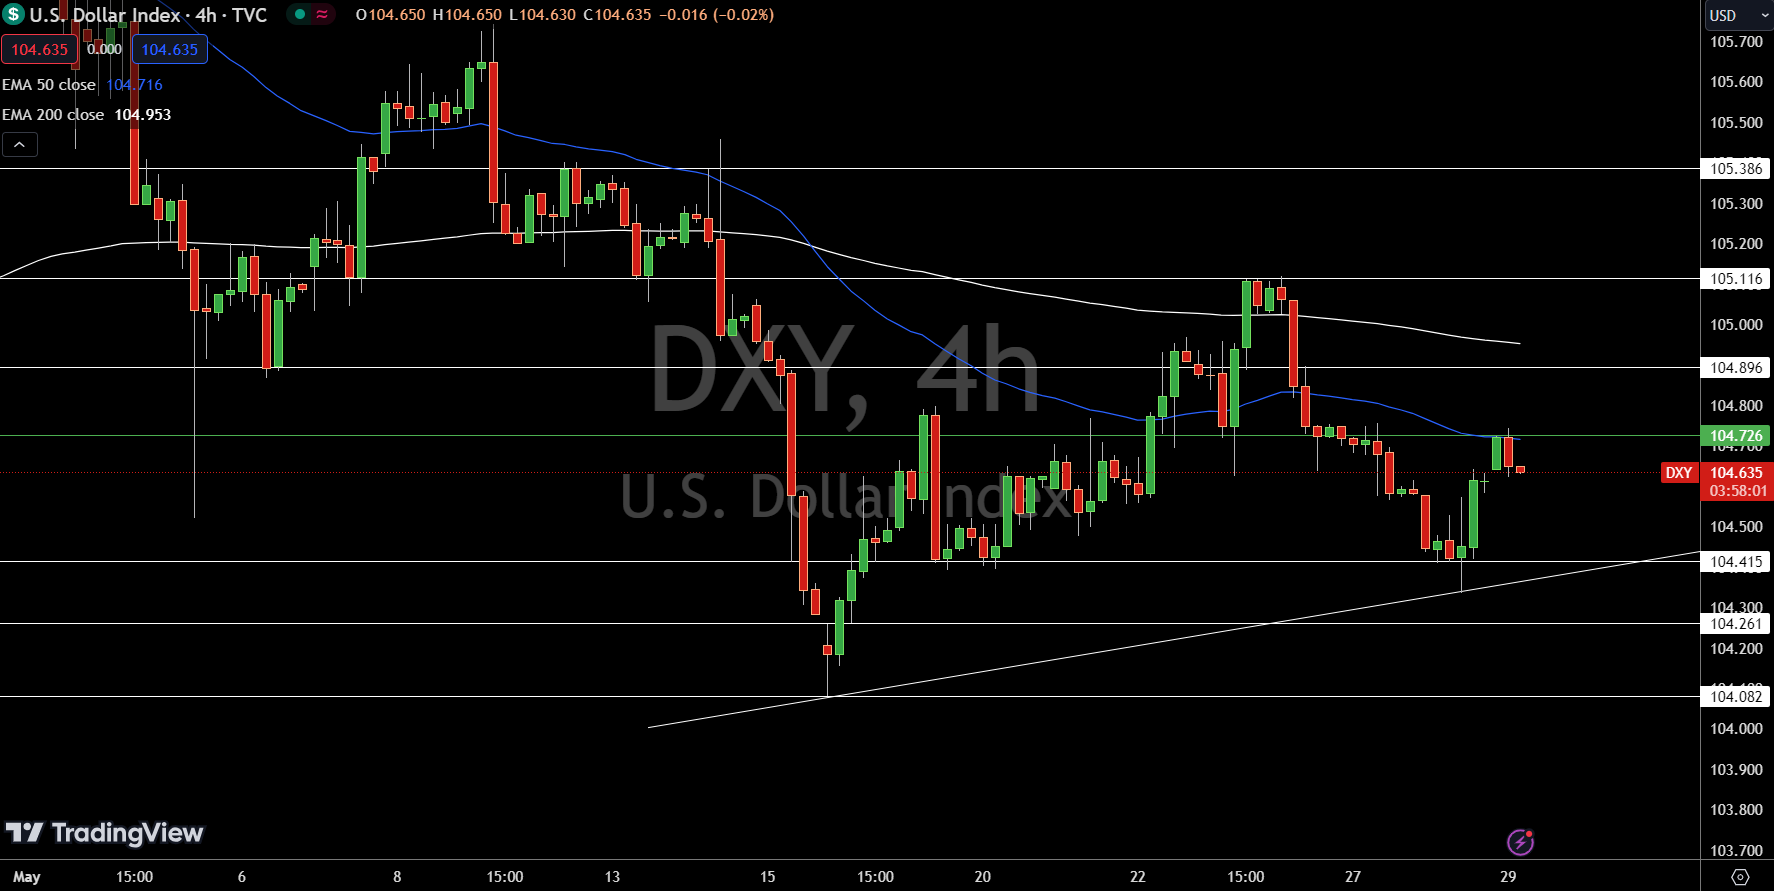
The Dollar Index (DXY) is trading at $104.635, up 0.12%. The pivot point is $104.726, marking a critical level for market direction. Immediate resistance levels are at $104.896, $105.116, and $105.386.
On the downside, immediate support is found at $104.415, followed by $104.261 and $104.082. The 50-day Exponential Moving Average (EMA) is at $104.716, while the 200-day EMA is at $104.953.
The current setup indicates a bearish outlook below $104.726, but a break above this level could increase bullish momentum. Traders should watch these key levels for potential market shifts.
EUR/USD Technical Forecast
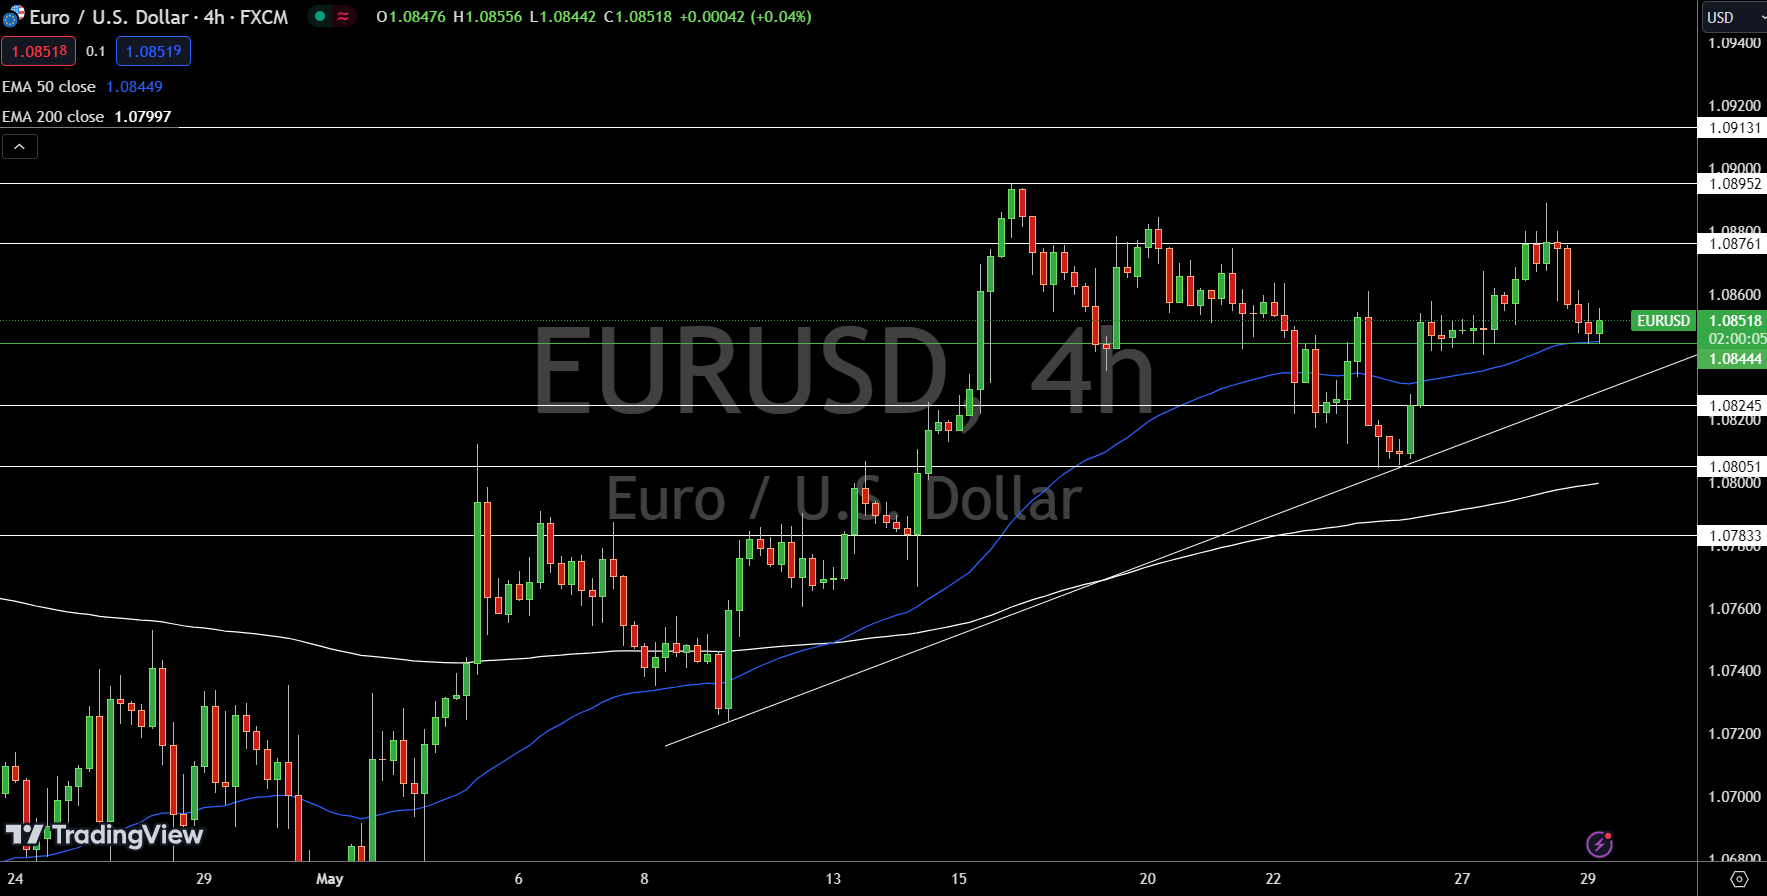
The outlook for EUR/USD remains bullish above the pivot point of $1.08444, but a break below this level could trigger a sharp selling trend.
GBP/USD Technical Forecast
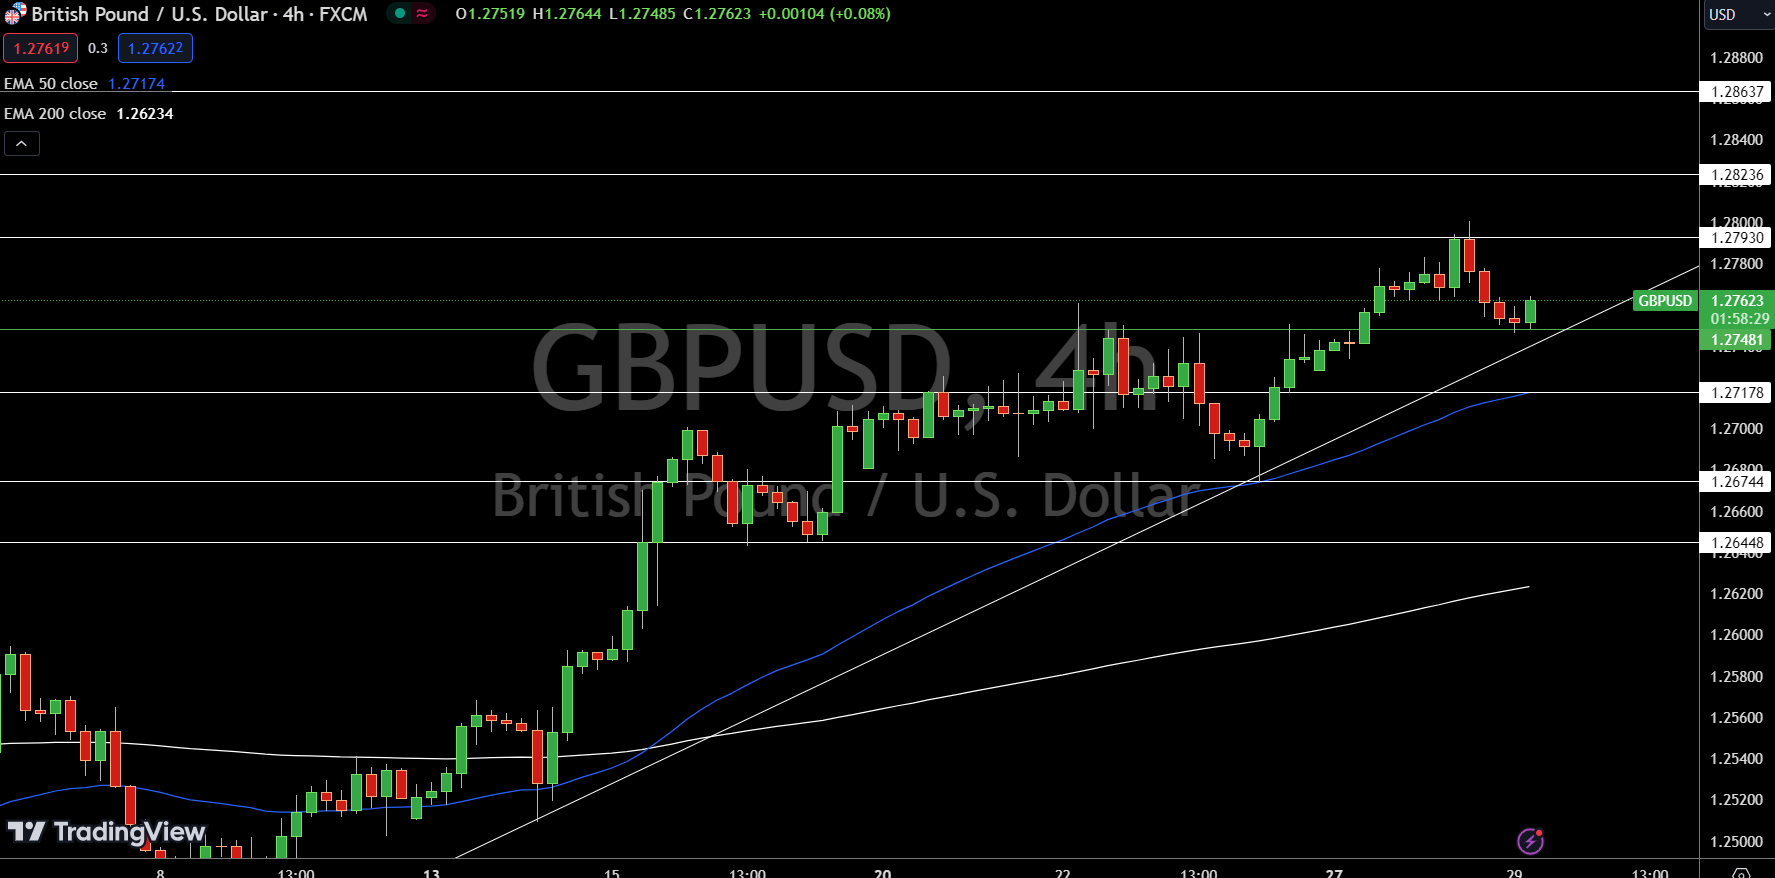
The GBP/USD pair is currently trading at $1.27623, reflecting a 0.12% decline. The pivot point is positioned at $1.27481, indicating a crucial support level. Immediate resistance levels are found at $1.27930, $1.28236, and $1.28637.
On the downside, support is seen at $1.27178, followed by $1.26744 and $1.26448. The 50-day Exponential Moving Average (EMA) stands at $1.27174, while the 200-day EMA is at $1.26234.
With the Relative Strength Index (RSI) showing a neutral stance, the pair maintains a bullish outlook above the pivot point of $1.27481. However, a break below this level could trigger a sharper decline.
For a look at all of today’s economic events, check out our economic calendar.