
Advertisement
Advertisement
AUD/USD Forex Technical Analysis – February 8, 2016 Forecast
By:
The AUD/USD sold-off sharply on Friday, leading to a lower close for the week. The catalyst behind the sell-off was a better-than-expected U.S. labor
The AUD/USD sold-off sharply on Friday, leading to a lower close for the week. The catalyst behind the sell-off was a better-than-expected U.S. labor report. It wasn’t the Non-Farm Payrolls number that drove the Australian Dollar lower and the U.S. Dollar higher, but the average hourly earnings that beat expectations, signaling growth and that means inflation.
The stronger average hourly earnings number may mean the Fed has the data it needs to raise rates at least once in 2016, barring any fresh weakness in the economy. At one point last week, Fed Funds traders had taken off any possibility of a rate hike in 2016. The new data on Friday likely means the return of volatility especially if investors decide to take the U.S. Dollar higher.
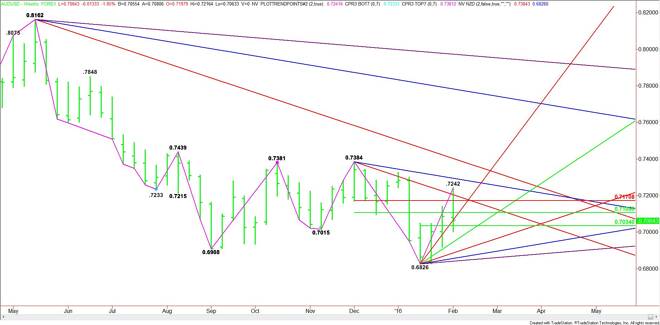
We’re going to look at the weekly chart today. Technically, the main trend is down according to the weekly chart. The main trend will turn up when the swing top at .7384 is taken out. A trade through the swing bottom at .6826 will signal the resumption of the downtrend.
The main range is .7384 to .6826. Its retracement zone is .7105 to .7171. This zone was straddled last week and begins this week as resistance.
The short-term range is .6826 to .7242. Its 50% level is .7034. Traders are likely to treat this price like a pivot this week.
Based on last week’s close at .7064, the direction of the market today is likely to be determined by trader reaction to the pivot at .7034.
Holding above this level will indicate the presence of buyers. The first upside target is the main 50% level at .7105. Overcoming this level could create enough upside momentum to test the steep uptrending angle at .7146.
Overtaking the angle at .7146 will put the AUD/USD in a strong position with the next targets the main Fibonacci level at .7171 and the downtrending angle at .7184.
The angle at .7184 is the one that stopped the rally last week at .7242. Overtaking this high could trigger a move into the next angle at .7284. This is the last potential resistance angle before the .7384 main top.
A sustained move under .7034 will signal the presence of sellers. This could trigger an acceleration into the next uptrending angle at .6986. This is followed by uptrending angles at .6906, .6866 and .6846. The latter is the last potential support angle before the .6826 main bottom.
Watch the price action and read the order flow at .7034 all week. Trader reaction to this level will tell us if the bulls or the bears are in control. Use this analysis in conjunction with the daily analysis all week.
About the Author
James Hyerczykauthor
James Hyerczyk is a U.S. based seasoned technical analyst and educator with over 40 years of experience in market analysis and trading, specializing in chart patterns and price movement. He is the author of two books on technical analysis and has a background in both futures and stock markets.


Advertisement