
Advertisement
Advertisement
Comex Gold Futures (GC) Technical Analysis – February 5, 2016 Forecast
By:
April Comex Gold futures are trading higher shortly before the regular session opening and the release of the latest U.S. Non-Farm Payrolls report for
April Comex Gold futures are trading higher shortly before the regular session opening and the release of the latest U.S. Non-Farm Payrolls report for January. The early price action suggests that aggressive traders are betting on a lower-than-expected number.
The report is expected to show the economy added 189K new jobs in January. This will be below December’s 292K reading. The unemployment rate is expected to come in at 5%. Average Hourly Earnings are expected to show a 0.3% rise. Also at 8:30 a.m. ET, the U.S. Bureau of Economic Analysis is expected to show the Trade Balance increased slightly to -42.9B.
A lower than expected headline reading in the jobs report should lead to more pressure on the U.S. Dollar and solidify expectations that the Fed will refrain from any interest rate hikes in 2016. This should be supportive for the gold futures.
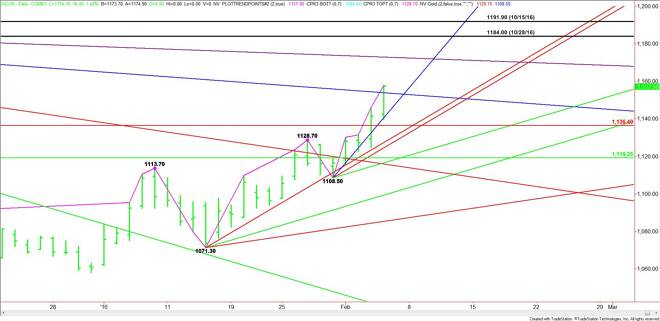
Technically, the main trend is up according to the daily swing chart. The main trend will turn down on a trade through $1108.50. The uptrend will be reaffirmed when the two tops at $1184.00 and $1191.90 are taken out.
The main range is $1191.90 to $1046.60. Its retracement zone at $1136.40 to $1119.20 is a support zone.
Based on yesterday’s close at $1157.50 and the early price action, the direction of the market is likely to be determined by trader reaction to the long-term downtrending angle at $1153.40 and the steep uptrending angle at $1148.50.
A sustained move over $1153.40 will indicate the presence of buyers. This could create enough upside momentum to trigger a follow-through rally into the next long-term downtrending angle at $1172.70. This is the last potential resistance angle before the main tops at $1184.00 and $1191.90.
A break under $1153.40 will signal the presence of sellers. A sustained move under $1148.50 will indicate that the selling is getting stronger. This could trigger a steep sell-off since the next support doesn’t come in until $1136.40. This is followed by a pair of uptrending angles at $1131.30 and $1128.50.
Watch the price action and read the order flow at $1148.50 today. Trader reaction to this angle will determine if the bulls are in control, or if the bears are taking over.
Since the market made a higher-high early in the session, it could form a potentially bearish closing price reversal top. Watch the price action and read the order flow on an intraday test of yesterday’s close at $1157.50. Trader reaction to this price will tell us if the buying or selling is greater at current price levels.
About the Author
James Hyerczykauthor
James Hyerczyk is a U.S. based seasoned technical analyst and educator with over 40 years of experience in market analysis and trading, specializing in chart patterns and price movement. He is the author of two books on technical analysis and has a background in both futures and stock markets.


Advertisement