
Advertisement
Advertisement
Comex Gold Futures (GC) Technical Analysis – February 8, 2016 Forecast
By:
April Comex Gold futures broke sharply from its high on Friday after the U.S. Dollar reversed to the upside. The catalyst behind the move was the
April Comex Gold futures broke sharply from its high on Friday after the U.S. Dollar reversed to the upside. The catalyst behind the move was the better-than-expected average hourly earnings component of the U.S. Non-Farm Payrolls report.
The strong average hourly earnings number represents inflationary growth. And this means the economy may be strong enough for at least one rate hike by the Fed in 2016. Early last week, investors had begun pricing in the possibility of no rate hikes by the Fed this year. This helped drive the dollar sharply lower and gold prices higher.
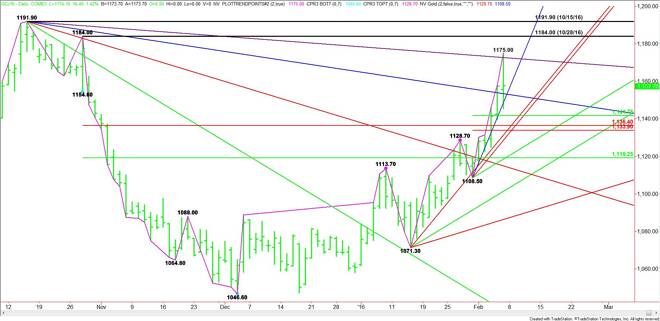
Technically, the main trend is up according to the daily swing chart. The trend will turn down on a trade through the last swing bottom at $1108.50.
The main range is $1191.90 to $1046.60. The market is currently trading on the strong side of its retracement zone at $1136.40 to $1119.20. This makes it new support.
The short-term range is $1108.50 to $1175.00. Its retracement zone is $1144.70 to $1133.90. This zone is the primary downside target.
Based on Friday’s close at $1157.70, the direction of the market today is likely to be determined by trader reaction to the steep uptrending angle at $1156.50.
A sustained move over $1156.50 will indicate the presence of buyers. If this can create some upside momentum then the next targets are a long-term downtrending angle at $1172.40 and Friday’s high at $1175.00. These are the last two potential resistance areas before the $1184.00 and $1191.90 main tops.
A sustained move under $1156.50 will signal the presence of sellers. The first target is a long-term downtrending angle at $1152.90.
Crossing to the weak side of the angle at $1152.90 will put gold in a bearish position. This could trigger a break into a short-term 50% level at $1141.70, a major Fibonacci level at $1136.40 and a short-term Fib level at $1133.90. These levels are followed by a pair of uptrending angles at $1135.30 and $1132.50.
Based on the current set-up, the best potential targets are the price clusters at $1136.40 to $1135.30 and $1133.90 to $1132.50. Since the main trend is up on the daily chart, we could see a technical bounce on the first test of these areas.
Watch the price action and read the order flow at $1156.50 today. Trader reaction to this angle will tell us if the bulls or the bears are in control. Today’s price action is likely to be driven by the direction of the U.S. Dollar.
About the Author
James Hyerczykauthor
James Hyerczyk is a U.S. based seasoned technical analyst and educator with over 40 years of experience in market analysis and trading, specializing in chart patterns and price movement. He is the author of two books on technical analysis and has a background in both futures and stock markets.


Advertisement