
Advertisement
Advertisement
Crude Oil forecast for the week of August 22, 2016, Technical Analysis
Published: Aug 20, 2016, 05:09 GMT+00:00
WTI Crude Oil The WTI Crude Oil market rallied during the course of the week, breaking well above the $44 level. In fact, we ended up breaking above $48
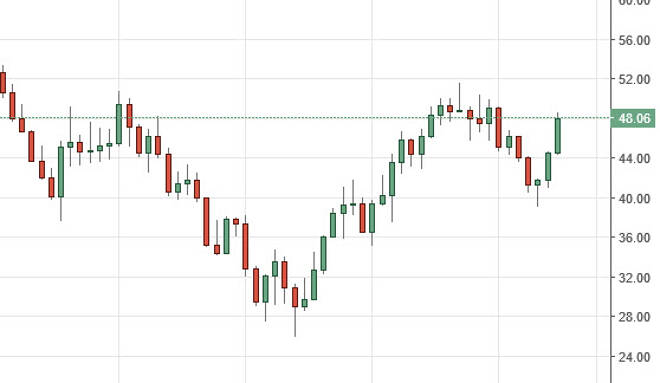
WTI Crude Oil
The WTI Crude Oil market rallied during the course of the week, breaking well above the $44 level. In fact, we ended up breaking above $48 at one point and it looks as if the market is trying to form a bit of an inverted head and shoulders. With this being the case, if we can break above the $52 level, I feel at that point in time the market could go much higher over the longer term. Having said that though, the Friday candle is a bit of a shooting star so we might get a pullback first. Given enough time though, it is going to be a situation where we have to make quite a bit of a decision close to the $50 handle. With this being the case, the market is likely to be very choppy and might be easier to trade off of short-term charts.
Brent
Brent markets rally during the course of the week, reaching towards the $51 level. I think if we can break above the $52 level we will go much higher. At this point in time, the candle looks very bullish, so I think that perhaps it could happen but we have not seen it happen yet so therefore I have to remain on the sidelines. It might be easier to trade this market off of the short-term charts as well as we are approaching a pretty significant amount of resistance.
At this point in time, I believe that the market is trying to break out to the upside, but it is going to be very volatile in this general vicinity. With this being the case, we are going to have to be patient and therefore buying right here could very well be reckless and also misconstrued as it would ignore the fact that we very well could pull back to the $44 level, and not negate we’ve seen recently as far as the bullish move. A break down below $44 level is of course very negative.
About the Author
Christopher Lewisauthor
Chris is a proprietary trader with more than 20 years of experience across various markets, including currencies, indices and commodities. As a senior analyst at FXEmpire since the website’s early days, he offers readers advanced market perspectives to navigate today’s financial landscape with confidence.


Advertisement