
Advertisement
Advertisement
Crude Oil forecast for the week of September 26, 2016, Technical Analysis
Published: Sep 24, 2016, 04:39 GMT+00:00
WTI Crude Oil The WTI Crude Oil market rallied during the course of the week, testing the $46 level. I believe at this point in time the market is still
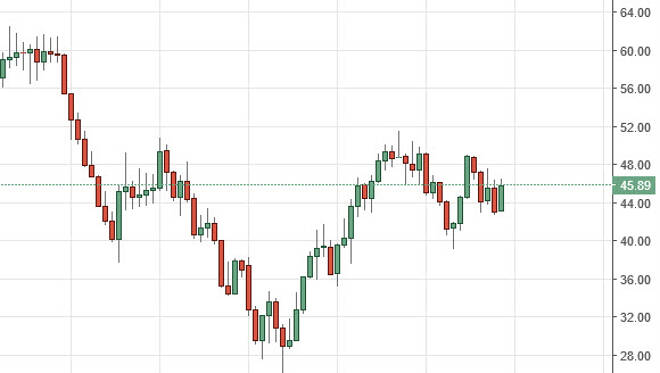
WTI Crude Oil
The WTI Crude Oil market rallied during the course of the week, testing the $46 level. I believe at this point in time the market is still continuing to consolidate, and with all of the moving pieces around the world, I think that we will continue to see quite a bit of choppiness more than anything else. With Saudi Arabia suggesting that perhaps they would cut production that the Iranians would do the same, that’s just the latest attempt to “talk up” the price of oil. In the end, we still have a massive oversupply, so at this point in time I believe there are far too many moves in both directions to make this an easy market to trade, especially from the longer-term perspective. I think short-term scalpers will continue to come back and forth in this market, but ultimately this is a market that cannot be traded with a longer-term perspective at the moment.
Brent
Brent markets tried to rally during the course of the week, but found enough resistance of the $48 level to turn things back around. Ultimately, this is a market that I think will chop around as well, mainly for the same reasons that we’ve seen recently, that people are willing to say things in the headlines that cause a lot of confusion, at the same time that we have quite a bit of bearish pressure. After all, the US dollar continues to be fairly strong, and at this point in time it’s likely that the short-term trades will be about all you get. I don’t have any interest in trading this from a longer-term perspective at the moment, but if we can break down below the $42 level, at this point in time the market should continue to grind back and forth.
Ultimately, the market has a bit of bearish pressure on it, so having said that I believe that we are waiting to see some type of exhaustive candle or impulsive negative candle to get involved. I don’t have any interest in buying at all until we get above the $52 handle.
About the Author
Christopher Lewisauthor
Chris is a proprietary trader with more than 20 years of experience across various markets, including currencies, indices and commodities. As a senior analyst at FXEmpire since the website’s early days, he offers readers advanced market perspectives to navigate today’s financial landscape with confidence.


Advertisement