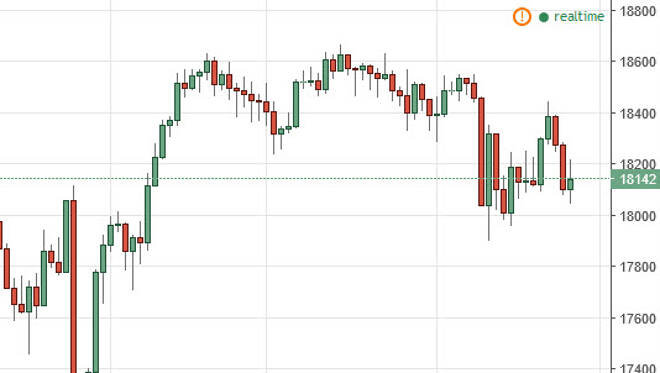
The Dow Jones 30 had a back-and-forth type of session on Tuesday, testing the 18,200 level. A break above there would be a bullish sign, as the market
The Dow Jones 30 had a back-and-forth type of session on Tuesday, testing the 18,200 level. A break above there would be a bullish sign, as the market should then reach towards the 18,400 level. A break above there is a very bullish sign as well, reaching towards the 18,600 level above that. Pullbacks at this point in time will continue to see a lot of support near the 18,000 level below, and therefore it’s likely that this market will continue to see quite a bit of buying pressure, and as a result I have noticed whatsoever in selling.
Chris is a proprietary trader with more than 20 years of experience across various markets, including currencies, indices and commodities. As a senior analyst at FXEmpire since the website’s early days, he offers readers advanced market perspectives to navigate today’s financial landscape with confidence.