
Advertisement
Advertisement
E-mini Dow Jones Industrial Average (YM) Futures Analysis – February 9, 2016 Forecast
By:
March E-mini Dow Jones Industrial Average futures are called lower shortly before the cash market opening. The market is also posting an inside move which
March E-mini Dow Jones Industrial Average futures are called lower shortly before the cash market opening. The market is also posting an inside move which suggests impending volatility.
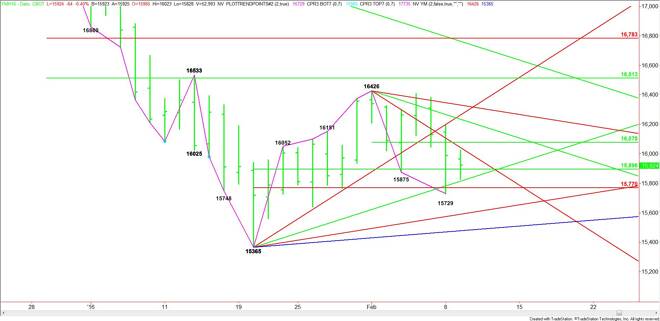
The main trend is down according to the daily swing chart. The trend will turn up on a trade through 15426 and down on a trade through 15365.
The main range is 15365 to 16426. Its retracement zone is 15896 to 15770. This zone provided support on Monday although the actual low came in at 15729. Earlier today, this zone provided support.
The short-term range is 16426 to 15729. Its 50% level or pivot is 16078. This price is essentially controlling the near-term direction of the market today.
Based on Monday’s close at 15988, the first downside targets are the 50% level at 15896, an uptrending angle at 15813, a Fibonacci level at 15770 and yesterday’s low at 15729.
The daily chart opens up to the downside under 15729. The next two potential targets are a pair of uptrending Gann angles at 15589 and 15477. The latter is the last potential support before the 15365 main bottom.
Taking out the downtrending angle at 16042 will signal the presence of buyers. This could create enough upside momentum to challenge the short-term pivot at 16078.
Overtaking 16078 could trigger an acceleration to the upside with the next major target a downtrending angle at 16234.
Look for an upside bias on a sustained move over 16042 and a downside bias on a sustained move under 15813. Watch for a choppy, two-sided trade if investors decide to straddle the 50% level at 15896.
Holding the retracement zone at 15896 to 15770 may be indicative of accumulation. We’ll be watching the market’s reaction to this zone to see if a support base begins to form.
About the Author
James Hyerczykauthor
James Hyerczyk is a U.S. based seasoned technical analyst and educator with over 40 years of experience in market analysis and trading, specializing in chart patterns and price movement. He is the author of two books on technical analysis and has a background in both futures and stock markets.


Advertisement