
Advertisement
Advertisement
E-mini NASDAQ-100 Index (NQ) Futures Technical Analysis – February 8, 2016 Forecast
By:
March E-mini NASDAQ-100 Index futures fell sharply on Friday amid a massive technology stock sell-off. The cash index shed as much as 3%. Traders blamed
March E-mini NASDAQ-100 Index futures fell sharply on Friday amid a massive technology stock sell-off. The cash index shed as much as 3%. Traders blamed mixed U.S. employment data which raised concerns the U.S. Federal Reserve may rates this year.
Earlier in the week, investors had abandoned the thought that the Fed would have the firepower to pull-off even one rate hike. After the release of Friday’s stronger-than-expected average hourly earnings data, traders now peg the odds of at least one rate hike in 2016 at 50%, and this will probably take place in December.
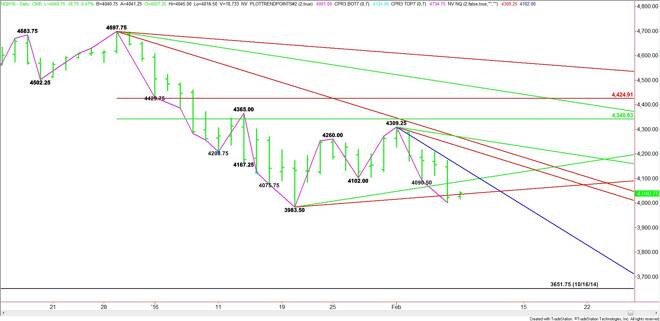
Today will be all about momentum and whether the sellers can continue the downside momentum generated into the close on Friday. Technically, the main trend is down according to the daily swing chart. The main trend turned down on February 5 when sellers took out the previous swing bottom at 4102.50.
Based on Friday’s close at 4022.00, the direction of the market today is likely to be determined by trader reaction to the uptrending angle at 4035.50.
Overcoming this angle will signal the presence of buyers. This may generate enough upside momentum to challenge the next uptrending angle at 4087.50. This is also a trigger point for an acceleration to the upside into the best resistance angle today at 4149.25.
The inability to overcome the uptrending angle at 4035.50 will indicate the presence of sellers. This could create enough downside momentum to challenge the January 20 main bottom at 3983.50.
This price is the trigger point for the start of a steep sell-off over the near-term with the next major target the October 16, 2014 main bottom at 3651.75.
Watch the price action and read the order flow at 4035.50 today. Trader reaction to this angle will tell us if the selling pressure is real, or if the buyers have returned to support the market.
About the Author
James Hyerczykauthor
James Hyerczyk is a U.S. based seasoned technical analyst and educator with over 40 years of experience in market analysis and trading, specializing in chart patterns and price movement. He is the author of two books on technical analysis and has a background in both futures and stock markets.


Advertisement