
Advertisement
Advertisement
E-mini NASDAQ-100 Index (NQ) Futures Technical Analysis – November 24, 2015 Forecast
By:
December E-mini NASDAQ-100 Index futures posted a potentially bearish closing price reversal top on Monday. The chart pattern was confirmed in today’s
December E-mini NASDAQ-100 Index futures posted a potentially bearish closing price reversal top on Monday. The chart pattern was confirmed in today’s pre-market session when sellers took out yesterday’s low at 4653.75. The move came about two days early and now it’s up to momentum to drive the market into its primary downside target over the next two to three days. The problem is that volume and volatility are expected to be below average this week because of Thursday’s U.S. bank holiday.
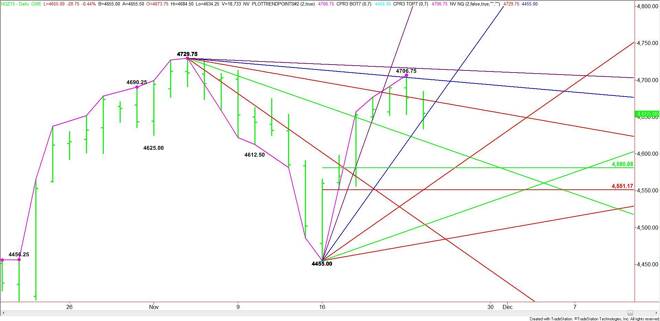
Based on yesterday’s close at 4675.75, the key angle to watch comes in at 4673.75. Trader reaction to this angle will set the tone for the session.
Early in the session, the index opened under the key angle, giving it an early downside bias. This led to a break under yesterday’s low at 4653.75 and a steep uptrending angle at 4647.00. The selling pressure took out both of these points but found intraday support at 4634.25.
Look for a downside bias today on a sustained move under the angle at 4647.00. This could trigger a break into a downtrending angle at 4617.75. Taking out this angle could trigger a further decline into the primary downside objective at 4580.75 to 4551.00.
Overcoming and sustaining a rally over 4673.75 will signal the presence of buyers. This may create enough upside momentum to test a downtrending angle at 4701.75. This is followed closely by the closing price reversal top at 4706.75. A trade through this top will negate the bearish chart pattern and likely lead to a test of the next downtrending angle at 4715.75. This is the last major angle before the 4729.75 main top.
Watch the price action and read the order flow at 4673.75 and 4647.00 today. A sustained move over 4673.75 will give the market an upside bias. A sustained move under 4647.00 will indicate the emergence of selling pressure.
The way of least resistance is to the downside with 4580.75 to 4551.00 the primary downside target. A rally is likely to be labored because of the number of resistance levels.
About the Author
James Hyerczykauthor
James Hyerczyk is a U.S. based seasoned technical analyst and educator with over 40 years of experience in market analysis and trading, specializing in chart patterns and price movement. He is the author of two books on technical analysis and has a background in both futures and stock markets.


Advertisement