
Advertisement
Advertisement
E-mini NASDAQ-100 Index (NQ) Futures Technical Analysis – November 27, 2015 Forecast
By:
December E-mini NASDAQ-100 Index futures nudged higher on Thursday. Volume was light, however, due to the limited electronic trading session. The index
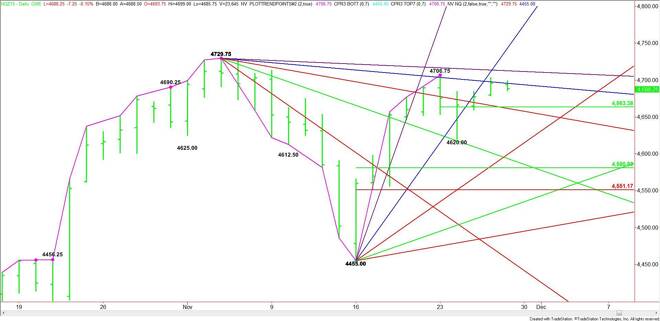
December E-mini NASDAQ-100 Index futures nudged higher on Thursday. Volume was light, however, due to the limited electronic trading session. The index closed within striking distance of the 4706.75 closing price reversal top and the 4729.75 main top.
The main trend is up according to the daily swing chart. Momentum may be shifting to the downside due to the potentially bearish closing price reversal top formation.
The main range is 4455.00 to 4706.75. If the selling pressure is strong enough over the near-term then traders are likely to go after its retracement zone at 4580.75 to 4551.00.
The short-term range is 4706.75 to 4620.00. Its pivot is 4663.25. This level is giving the market short-term support.
Based on the close at 4695.50, the direction of the market is likely to be determined by trader reaction to the angle at 4695.75.
A sustained move over the angle will indicate the presence of buyers. The first target is the closing price reversal top at 4706.75. Taking out this top will negate the chart formation and could trigger an acceleration into the downtrending angle at 4712.75. This is the last potential resistance angle before the 4729.75 main top.
Taking out 4729.75 could trigger a further acceleration to the upside with the next target a steep uptrending angle at 4743.00. Crossing to the strong side of this angle will put the index in an extremely strong position.
A sustained move under 4695.75 will signal the presence of sellers. This could lead to an acceleration to the downside with the first target the short-term pivot at 4663.25. This is followed closely by a downtrending angle at 4661.75.
The angle at 4661.75 is also a trigger point for the start of a steep acceleration to the downside with the next target an uptrending angle at 4599.00.
Watch the price action and read the order flow at 4695.75 today. Trader reaction to this angle will tell us whether the bulls or the bears are in control.
About the Author
James Hyerczykauthor
James Hyerczyk is a U.S. based seasoned technical analyst and educator with over 40 years of experience in market analysis and trading, specializing in chart patterns and price movement. He is the author of two books on technical analysis and has a background in both futures and stock markets.


Advertisement