
Advertisement
Advertisement
E-mini S&P 500 Index (ES) Futures Technical Analysis – February 8, 2016 Forecast
By:
March E-mini S&P 500 Index futures finished sharply lower on Friday after the stronger-than-expected average hourly earnings component of the U.S.
March E-mini S&P 500 Index futures finished sharply lower on Friday after the stronger-than-expected average hourly earnings component of the U.S. Non-Farm Payrolls report may have put the Fed back on track for at least one interest rate hike in 2016. The headline number, however, suggested the economy was weakening with 151,000 jobs added in January versus an estimate of 190,000. This added to the uncertainty over the timing of the Fed rate hike.
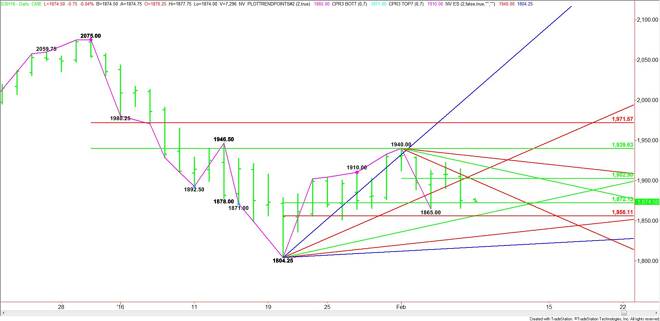
Technically, the main trend is down according to the daily swing chart. The main trend will turn up on a drive through the main top at 1940.00.
The main range is 2075.00 to 1804.25. Its retracement zone at 1939.75 to 1971.50 is the primary upside target.
The short-term range is 1940.00 to 1865.00. Its 50% level comes in at 1902.50. Traders should treat this price like a pivot.
The intermediate range is 1804.25 to 1940.00. Its retracement zone at 1872.00 to 1856.00 is the primary downside target. This zone provided support twice last week and is currently being tested.
Based on Friday’s close at 1875.25, the direction of the market today will likely be decided by trader reaction to the intermediate 50% level at 1872.00.
A sustained move over 1872.00 will indicate the presence of buyers. This could create enough upside momentum to challenge a downtrending angle at 1900.00. This is followed closely by the pivot at 1902.50.
Crossing to the strong side of the pivot at 1902.50 and the uptrending angle at 1908.25 will put the index in a bullish position. This could lead to a test of a pair of angles at 1920.00 and 1930.00. The latter is the last potential resistance angle before the 1940.00 main top.
A sustained move under 1872.00 will signal the presence of sellers. The first downside target is last week’s low at 1865.00. The most important area to watch is the price cluster at 1856.25 to 1856.00. Watch for a technical bounce on the first test of this area.
The Fib level at 1856.00 is also the trigger point for the start of a steep decline with potential targets coming in at 1830.25 and 1817.25. The latter is the last potential support before the 1804.25 main bottom.
Watch the price action and read the order flow at 1902.50 today. Trader reaction to this level will tell us if the bulls or the bears are in control.
About the Author
James Hyerczykauthor
James Hyerczyk is a U.S. based seasoned technical analyst and educator with over 40 years of experience in market analysis and trading, specializing in chart patterns and price movement. He is the author of two books on technical analysis and has a background in both futures and stock markets.


Advertisement