
Advertisement
Advertisement
GBP/USD forecast for the week of May 23, 2016, Technical Analysis
Updated: May 21, 2016, 04:55 GMT+00:00
The GBP/USD pair initially tried to rally during the course of the week, but found the area above the 1.45 level to cause quite a bit of resistance again.
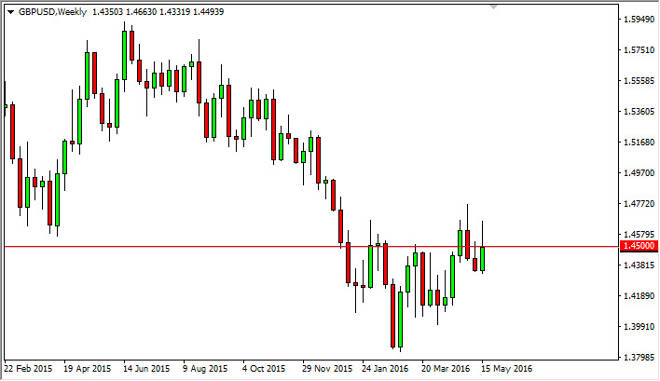
The GBP/USD pair initially tried to rally during the course of the week, but found the area above the 1.45 level to cause quite a bit of resistance again. Because of this, we did up forming something that looks a bit like a shooting star, and as a result we could see selling pressure increase. A break down below the bottom of the shooting star from this week also has the market breaking down below the shooting star from the previous week. If that’s the case, the market will selloff, possibly all the way down to the 1.41 handle. On the other hand, if we break above the top of the weekly candle, this market could continue to go much higher, perhaps the 1.50 level.
Check out our new GBP/JPY Weekly forecast!
About the Author
Christopher Lewisauthor
Chris is a proprietary trader with more than 20 years of experience across various markets, including currencies, indices and commodities. As a senior analyst at FXEmpire since the website’s early days, he offers readers advanced market perspectives to navigate today’s financial landscape with confidence.


Advertisement