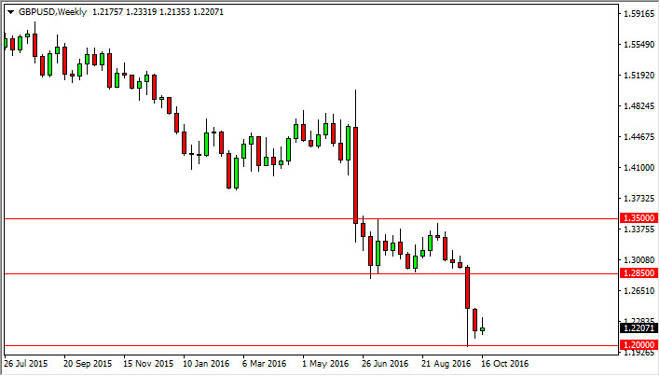
The GBP/USD pair went back and forth during the course the week, and ended up forming a less than impressive candle. If we break above the top of the
The GBP/USD pair went back and forth during the course the week, and ended up forming a less than impressive candle. If we break above the top of the range during the course of the week, it’s very likely that we continue to go higher, but I still think that the 1.2850 level is a bit of a ceiling. Because of this, it’s likely that the market will continue to be negative overall. With this, I feel much more comfortable shorting on signs of exhaustion or break down below the 1.20 level which should be massively supportive.
Chris is a proprietary trader with more than 20 years of experience across various markets, including currencies, indices and commodities. As a senior analyst at FXEmpire since the website’s early days, he offers readers advanced market perspectives to navigate today’s financial landscape with confidence.