Gold markets initially tried to rally during the course of the week but found resistance above the $1280 level and turned right back around. We fell down
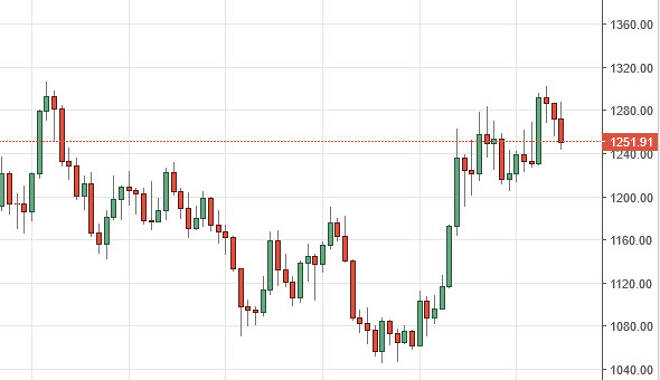
Gold markets initially tried to rally during the course of the week but found resistance above the $1280 level and turned right back around. We fell down towards the $1240 level, but found enough support there to stop falling. With this, it looks as if the market is testing serious support, which extends all the way down to the $1200 level. We don’t have a supportive candle to start buying, but we most certainly keep an eye out for one appearing. It is not until we break down below the $1200 level that we would consider selling.
Chris is a proprietary trader with more than 20 years of experience across various markets, including currencies, indices and commodities. As a senior analyst at FXEmpire since the website’s early days, he offers readers advanced market perspectives to navigate today’s financial landscape with confidence.