Gold markets fell significantly during the course of the week, breaking down to the $1215 level. We still see quite a bit of support at the $1200 level,
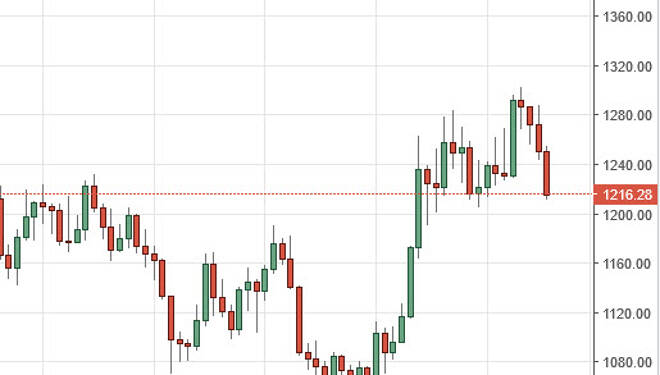
Gold markets fell significantly during the course of the week, breaking down to the $1215 level. We still see quite a bit of support at the $1200 level, so at this point in time it’s very likely that we will see a bit of a bounce at that area if we reach it. However, if we can break down below that Larry a, it’s very likely that the market will continue to go lower. Ultimately, we closed at the bottom of the range, so at this point in time you have to think that there is still quite a bit of bearish pressure though.
Chris is a proprietary trader with more than 20 years of experience across various markets, including currencies, indices and commodities. As a senior analyst at FXEmpire since the website’s early days, he offers readers advanced market perspectives to navigate today’s financial landscape with confidence.