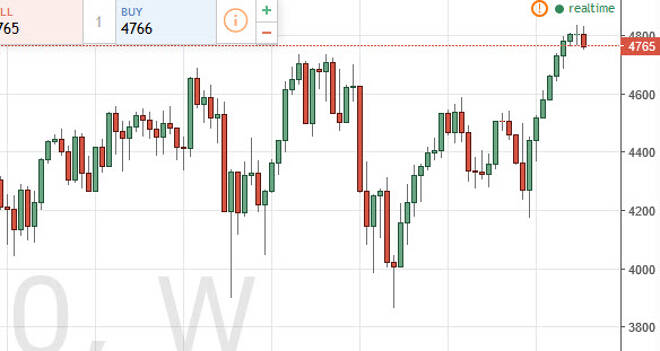
The NASDAQ 100 initially tried to rally during the course of the week but found the area above the 4800 level before too exhaustive. By doing so, we ended
The NASDAQ 100 initially tried to rally during the course of the week but found the area above the 4800 level before too exhaustive. By doing so, we ended up forming a slightly negative candle but I think there’s more than enough support just below to keep this market going higher. This is a market that has been somewhat parabolic so a pullback from here is very healthy. I’m waiting to see signs of support or a bounce that I can take advantage of in the longer-term trend.
Chris is a proprietary trader with more than 20 years of experience across various markets, including currencies, indices and commodities. As a senior analyst at FXEmpire since the website’s early days, he offers readers advanced market perspectives to navigate today’s financial landscape with confidence.