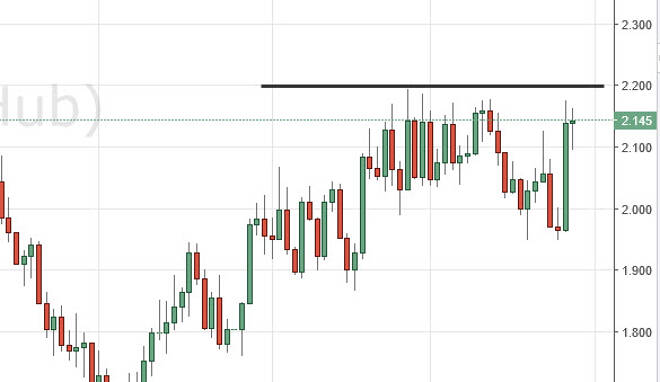
The natural gas markets initially fell during the day on Friday, but found support at the $2.10 level to turn around and form a nice-looking hammer. The
The natural gas markets initially fell during the day on Friday, but found support at the $2.10 level to turn around and form a nice-looking hammer. The hammer sits just below the $2.20 level, which is a massive resistance barrier. If we can get above there on a daily close, then I feel comfortable buying this market, and will do so and aim for the $2.30 level. Pullbacks at this point in time should continue to be supported down near the $2.10 level, but if we can break down below there we would be able to start selling.
Chris is a proprietary trader with more than 20 years of experience across various markets, including currencies, indices and commodities. As a senior analyst at FXEmpire since the website’s early days, he offers readers advanced market perspectives to navigate today’s financial landscape with confidence.