Natural gas markets initially fell during the course of the week, testing the $2.60 region. We bounced enough to form a nice-looking hammer though, just
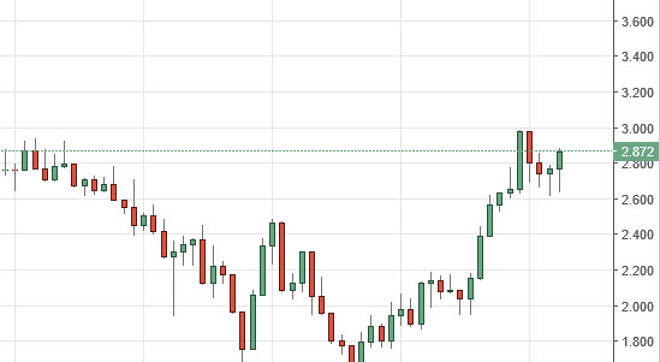
Natural gas markets initially fell during the course of the week, testing the $2.60 region. We bounced enough to form a nice-looking hammer though, just as we did the previous week. Because of this, it looks as if we are going to test the $3.00 level above, and perhaps try to break out. Ultimately, if we can get above there it is a very bullish sign for the natural gas market. Expect volatility no, this has been an area that has previously offered a significant amount of resistance.
Chris is a proprietary trader with more than 20 years of experience across various markets, including currencies, indices and commodities. As a senior analyst at FXEmpire since the website’s early days, he offers readers advanced market perspectives to navigate today’s financial landscape with confidence.