
Advertisement
Advertisement
Nearby Crude Oil Monthly Technical Analysis for December 2015
By:
January Crude Oil futures finished November at $41.68, down $5.79, or 12.20%. The global supply glut and firmer U.S. Dollar were the primary drivers of
January Crude Oil futures finished November at $41.68, down $5.79, or 12.20%. The global supply glut and firmer U.S. Dollar were the primary drivers of last month’s selling pressure.
The key event to watch in December takes place early in the month. Traders don’t expect OPEC to cut production at its December 4 meeting, but it could introduce the idea of price support measures with other oil producers. There is also speculation that OPEC and Russia could strike a deal to reduce production. However, there are even rumors that Russia won’t go to the meeting after all. Any news that suggests a cut in production should help underpin crude oil prices.
On the bearish side, recent government data showed no meaningful decline in shale output in September despite a steady drop in rig counts. Additionally, recent data from the U.S. Commodity Futures Trading Commission showed that bullish positions held in West Texas Intermediate crude oil by hedge funds and other speculators fell to its lowest level in more than five years.
Other data showed that OPEC production may have risen by 130,000 barrels per day in November. Government data showed September output of U.S. crude fell by just 20,000 barrels per day to 9.326 million bpd in September.
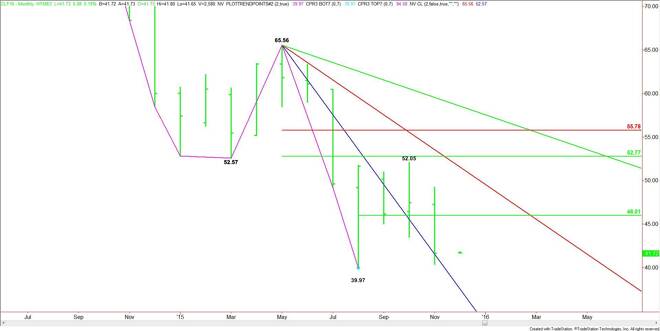
The main trend is down according to the monthly swing chart. The short-term range is $65.56 to $39.97. Its 50% level or pivot is $46.01. Trader response to this pivot will determine the direction of the market in December.
A sustained move under $46.01 will indicate the presence of sellers. Taking out the previous bottom at $39.97 will indicate that the selling is getting stronger. Crossing to the weak side of the steep downtrending angle at $37.56 will also put the market in an extremely bearish position.
A sustained move over $46.01 will signal the presence of buyers. This may generate enough upside momentum to challenge the nearest resistance angle at $51.56. This is followed closely by a minor top at $52.05 and a key 50% level at $52.77.
Watch the price action and read the order flow at $46.01 and $37.56 in December. Trader reaction to these levels will tell us whether the bulls or the bears are in control.
About the Author
James Hyerczykauthor
James Hyerczyk is a U.S. based seasoned technical analyst and educator with over 40 years of experience in market analysis and trading, specializing in chart patterns and price movement. He is the author of two books on technical analysis and has a background in both futures and stock markets.


Advertisement