The S&P 500 rally during the course of the week, breaking above the 2170 handle. A break above the 2200 level would be very positive, as we continue
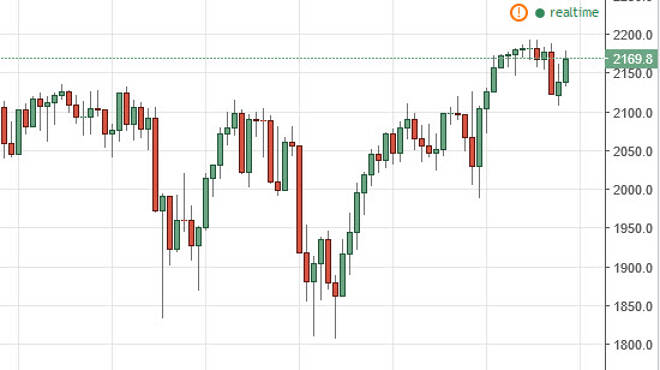
The S&P 500 rally during the course of the week, breaking above the 2170 handle. A break above the 2200 level would be very positive, as we continue to grind higher overall. A pullback should continue to offer value that you can take advantage of, and I believe that the 2100 level below is essentially the “floor” in this market. With that, I’m a buyer and a buyer only, but I also realize that you will have to deal with quite a bit of volatility on the longer-term charts.
Chris is a proprietary trader with more than 20 years of experience across various markets, including currencies, indices and commodities. As a senior analyst at FXEmpire since the website’s early days, he offers readers advanced market perspectives to navigate today’s financial landscape with confidence.