
Advertisement
Advertisement
US Dollar Index (DX) Futures Technical Analysis – February 5, 2016 Forecast
By:
March U.S. Dollar Index futures are trading flat-to-higher ahead of today’s U.S. Non-Farm Payrolls report. The report is expected to show the economy
March U.S. Dollar Index futures are trading flat-to-higher ahead of today’s U.S. Non-Farm Payrolls report. The report is expected to show the economy added 189K new jobs in January. This will be below December’s 292K reading. The unemployment rate is expected to come in at 5%. Average Hourly Earnings are expected to show a 0.3% rise. Also at 8:30 a.m. ET, the U.S. Bureau of Economic Analysis is expected to show the Trade Balance increased slightly to -42.9B.
A lower than expected headline reading in the jobs report should lead to more pressure on the U.S. Dollar and solidify expectations that the Fed will refrain from any interest rate hikes in 2016.
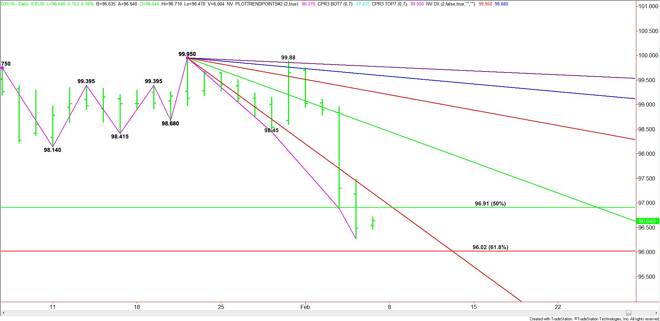
Technically, the main trend is down according to the daily swing chart. Despite the downtrend, the market is in the window of time for a potentially bullish closing price reversal bottom. This will likely be triggered by profit-taking. A reversal at this point on the chart will not mean the trend is getting ready to change to up, but it could indicate that the buying is greater than the selling at current price levels.
Based on yesterday’s close at 96.49, the first downside target is the major Fibonacci level at 96.02. There could be a technical bounce on the first test of this level, or investors may choose to straddle it for some time today. If sellers take this level out with conviction and can sustain the move then look for an eventual test of the October 16 main bottom at 94.05.
The first upside target is the major 50% level at 96.91. This is followed closely by the steep downtrending angle at 97.20. Overtaking this angle will indicate that the short-covering is getting stronger. The daily chart also indicates that this is a potential trigger point for an acceleration to the upside with the next major targets the series of previous bottoms at 98.14, 98.415, 98.45 and a downtrending angle at 98.58.
Look for a sideways trend and a wide range today if the index stays between 96.91 and 96.02. Look for an upside bias on a sustained move over 96.91 and a downside bias on a sustained move under 96.02.
If 96.27 gets taken out and there isn’t much follow-through to the downside then watch the price action at 96.49 the rest of the session. A close over this level will produce a potentially bullish closing price reversal bottom.
About the Author
James Hyerczykauthor
James Hyerczyk is a U.S. based seasoned technical analyst and educator with over 40 years of experience in market analysis and trading, specializing in chart patterns and price movement. He is the author of two books on technical analysis and has a background in both futures and stock markets.


Advertisement