
Advertisement
Advertisement
US Dollar Index (DX) Futures Technical Analysis – February 8, 2016 Forecast
By:
March U.S. Dollar Index futures rebounded enough on Friday to close higher after an early session sell-off. The rally was triggered by
March U.S. Dollar Index futures rebounded enough on Friday to close higher after an early session sell-off. The rally was triggered by better-than-expected average hourly earnings, a key component of the U.S. jobs report.
The strong number forced U.S. Dollar investors to reevaluate the current assessment that the economy is too weak for the Fed to raise interest rates in 2016. The strong recovery rally indicates that investors have to make adjustments to their previous short positions. This could fuel a further rally today.
Technically, the main trend is down according to the daily swing chart. However, the index posted a potentially bullish closing price reversal on Friday, indicating a possible shift in momentum to the upside.
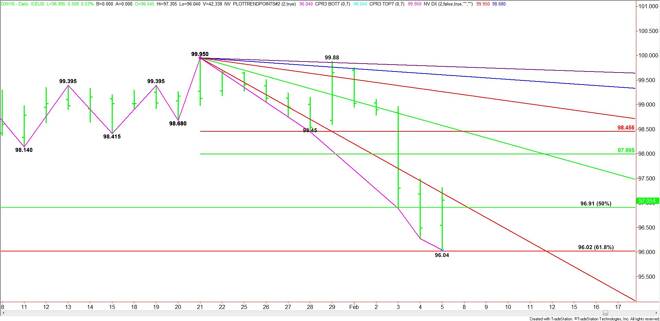
The long-term range is 93.125 to 100.70. Its retracement zone is 96.91 to 96.02. This zone was tested last week and provided support on Friday when the market reached its low at 96.04 and reversed to the upside.
The new short-term range is 99.95 to 96.04. Its retracement zone and primary upside target is 97.995 to 98.46.
Based on Friday’s close at 97.05, the direction of the market today is likely to be determined by trader reaction to the downtrending angle at 96.95 and the main 50% level at 96.91.
A sustained move over 96.95 will signal the presence of buyers. This could create enough upside momentum to challenge Friday’s high at 97.305.
A trade through 97.31 will confirm the closing price reversal bottom. This could trigger an acceleration to the upside with the first major target the short-term 50% level at 97.995. Overtaking this level and sustaining the move could fuel a further rally into the short-term Fibonacci level at 94.46 and the downtrending angle at 98.45.
A sustained move under the 50% level at 96.91 will signal the presence of sellers or the lack of buyers. They may not want to pay up to get long so they may allow the market to pullback into perhaps 96.67. This is followed by the closing price reversal bottom at 96.04 and the main Fibonacci level at 96.02. A failure at this price could trigger a sharp break.
Look for an upside bias on a sustained move over 96.95, but don’t expected an acceleration to the upside unless 97.31 is taken out with conviction. Look for a downside bias on a sustained move under 96.91.
About the Author
James Hyerczykauthor
James Hyerczyk is a U.S. based seasoned technical analyst and educator with over 40 years of experience in market analysis and trading, specializing in chart patterns and price movement. He is the author of two books on technical analysis and has a background in both futures and stock markets.


Advertisement