The USD/JPY pair initially tried to rally during the course of the week, but turned back around to form a shooting star. The 105 level below is
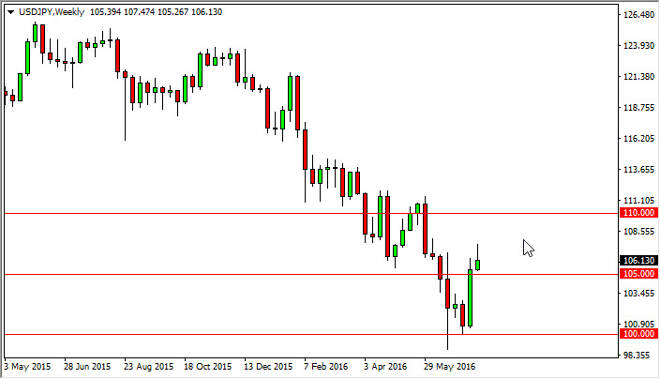
The USD/JPY pair initially tried to rally during the course of the week, but turned back around to form a shooting star. The 105 level below is supportive, so if we can break down below there I feel that we will more than likely drop down to the 103 level. On the other hand, if we can break above the top of the shooting star, I believe that the market could reach towards the 108 with this, and then eventually the 110 level. Ultimately, I believe that the long-term downtrend continues, and as a result the sellers could very well jump back in.
Chris is a proprietary trader with more than 20 years of experience across various markets, including currencies, indices and commodities. As a senior analyst at FXEmpire since the website’s early days, he offers readers advanced market perspectives to navigate today’s financial landscape with confidence.