
Advertisement
Advertisement
USD/JPY Monthly Technical Analysis for December 2015
By:
The USD/JPY closed at 123.100 in November, up 2.4550, or 2.03%. The catalyst behind the rally was expectations of a Fed interest rate hike in December.
The USD/JPY closed at 123.100 in November, up 2.4550, or 2.03%. The catalyst behind the rally was expectations of a Fed interest rate hike in December. Look for the market to continue to find support because of the divergence between the Bank of Japan and the U.S. Federal Reserve monetary policies.
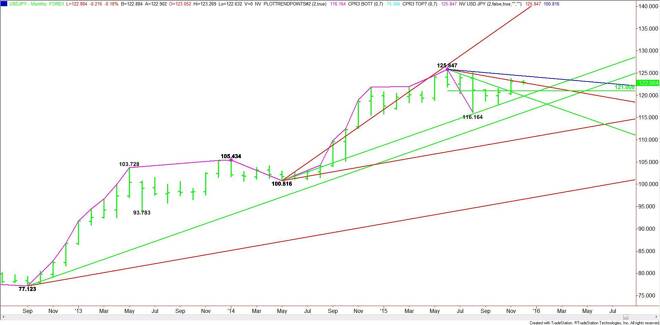
Technically, the main trend is up according to the monthly swing chart. A trade through 125.847 will signal a resumption of the uptrend. Taking out 116.164 will change the main trend to down.
Based on the close at 123.100, the key angle to watch comes in at 122.85. Trader reaction to this angle will set the tone for the month.
A sustained move over 122.85 will signal the presence of buyers. This could create enough upside momentum to challenge the next downtrending angle at 124.35. This is the last potential resistance angle before the 125.85 main top.
A sustained move under 122.85 will indicate the presence of sellers. The chart indicates there is room to the downside with the first target a 50% level or pivot at 121.01. This is followed by an uptrending angle at 119.82.
Watch the price action and read the order flow at 122.85 in December. Trader reaction to this angle will tell us whether the bulls or the bears are in control.
About the Author
James Hyerczykauthor
James Hyerczyk is a U.S. based seasoned technical analyst and educator with over 40 years of experience in market analysis and trading, specializing in chart patterns and price movement. He is the author of two books on technical analysis and has a background in both futures and stock markets.


Advertisement