
Advertisement
Advertisement
Weekly Technical Outlook: USD/JPY;Market Forecasts for October 17th – October 21st
Published: Oct 17, 2016, 08:41 GMT+00:00
Resistance level 105.615, 106.519, 107.0156 Pivot Level 103.836 Support Level 102.932 Technical Analysis The USDJPY pair closed weekend trading above
- Resistance level 105.615, 106.519, 107.0156
- Pivot Level 103.836
- Support Level 102.932
Technical Analysis
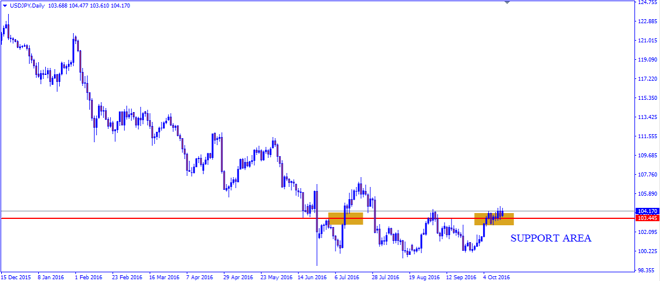
The USDJPY pair closed weekend trading above 102.932 levels in order to get a good support base that reinforces the expectations of continuing the bullish bias and providing signals for the price recovery in the upcoming days.
This is supported by stochastic positivism that appears clearly on the daily time frame and rises above 67.0 levels. The pair remains bullish for the moment with pair trading on rebound.
After testing barriers, it makes the trading settle now at the support area and appears in the chart. Some consolidations would be seen with bullish momentum and further rise is expected from current levels with price action signaling back to back two bar reversal on the new found support area.
The indicates the beginning of a new trend and the first main target is located at 105.615 levels pointing that breaking 106.519 levels besides holding above it will push the price to being bullish and the next target is located at 107.0156 levels.
Economic
- Capacity Utilization, Industrial Production, Consumer Price Index
- NAHB Housing Market Index, Building Permits, FOMC Member Williams speech
- Initial Jobless Claims, Existing Home Sales
- Industrial Production, All Industry Activity Index
- Foreign investment in Japan stocks
Area of Interest
- Strong support at 102.932 areas and closed above rebound of trend line.
- Bullish two bar reversal strongly closing above the support area.
- Price action closed above rebound of trend line and oscillator rising above 67.0 levels indicating shift in momentum.
- At Flip Area on Daily time frame support levels.
For more detailed analysis from the author, please visit NoaFX.
About the Author
Sylvester Stephencontributor


Advertisement