
Advertisement
Advertisement
Gold Price Forecast: Intraday Bullish Reversal Shows Strength
By:
Gold completes a 50% retracement, rebounds to 2,334, signaling potential upside breakout.
In this article:
Gold completed a 50% retracement today with a low of 2,291 before buyers took control and ran the precious metal up to a high of 2,334, at the time of this writing. Earlier in Tuesday’s session the sellers were in control and dropped gold down to below its 20-Day MA to test support around the 50% retracement of the internal upswing. The 50% level is at 2,289. That is close enough given the subsequent bullish reaction following that low.
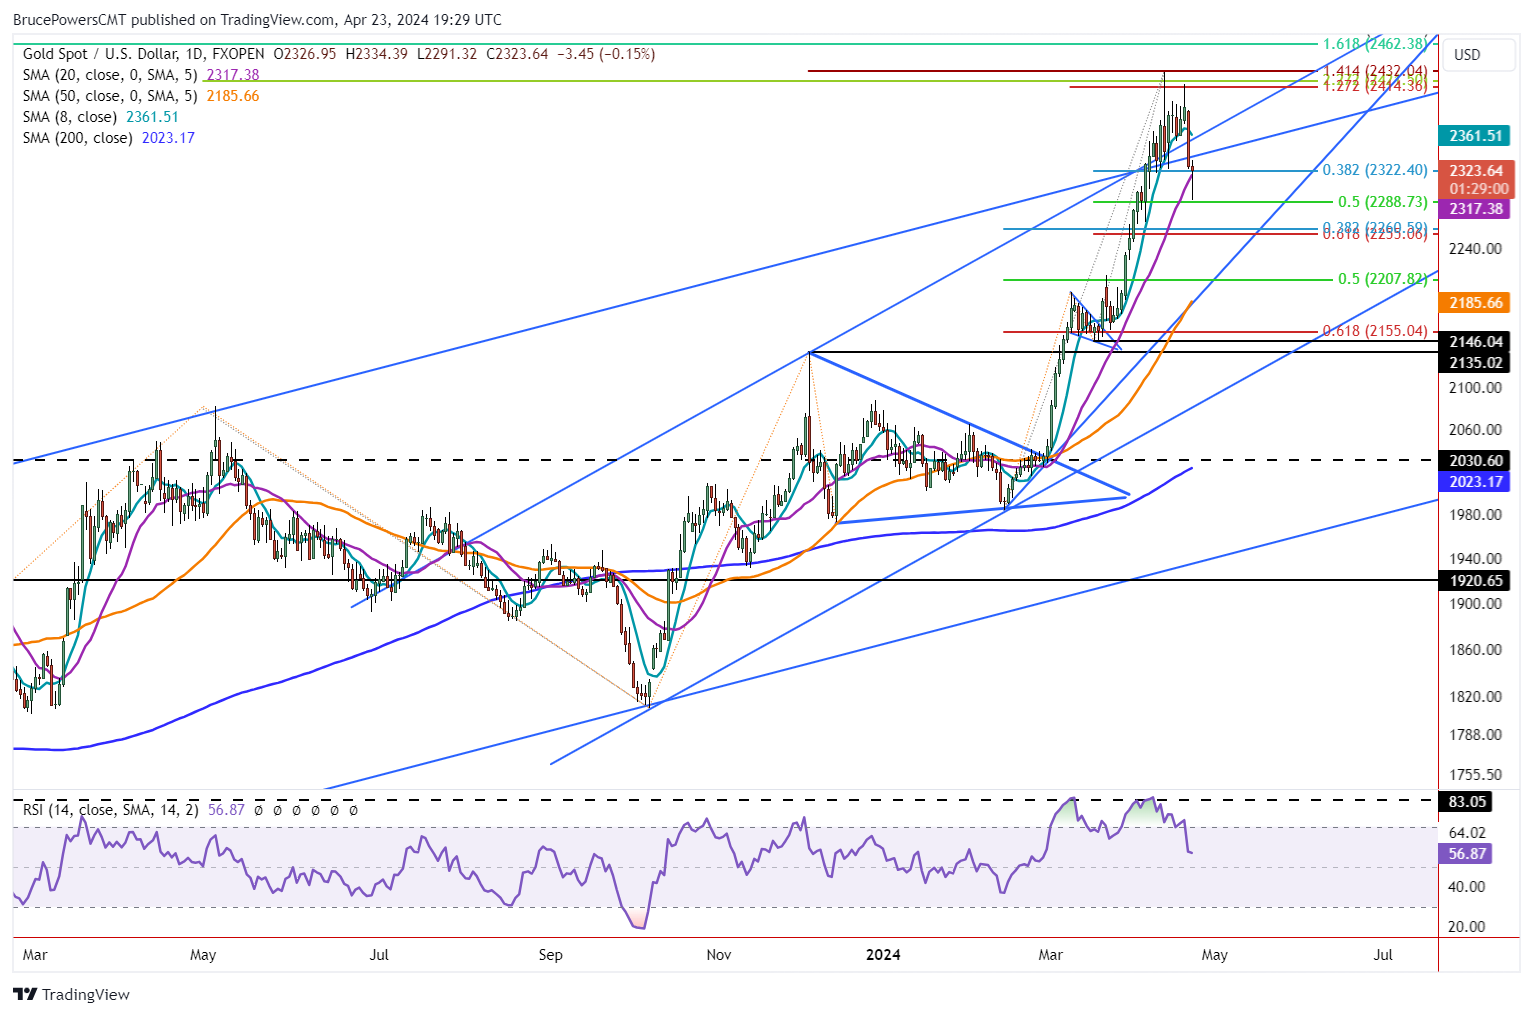
Quick Recovery of 20-Day Line is Bullish
Since around February 23 gold has been trading above the 20-Day line. Today was the first direct test of the line as support since then. Although it failed to maintain support, gold may close above the line with a bullish doji hammer candlestick pattern. Both a close above the 20-Day MA is bullish, and the fast recovery of the line is also bullish. It points to the possibility that a correction may be complete, or at least for now.
Upside Breakout Above Tuesday’s High
An upside breakout will be triggered on a rally above today’s high of 2,334, while a drop below today’s low of 2,291 signals a continuation of the correction. Also, gold could trade tomorrow inside day, which would provide a setup for Wednesday. A rally will be heading up into a potential resistance zone that arguably starts from around 2,354. Also, keep an eye on potential resistance around the 8-Day MA at 2,362 and this week’s high of 2,389.
Long-term Base Breakout in Play
Gold broke out of a multi-year basing pattern recently, which greatly improved its chances to continue to strengthen and trend higher following a correction. The degree and length of the current correction will tell us something about underlying demand. It should not be surprising if it stays strong given the significance of the long-term breakout. Upward momentum really kicked in upon the breakout of a symmetrical triangle on February 29. By March 5 a new record high in gold had been reached.
Drop Below 2,291 Starts a Deeper Retracement
There will likely be a retracement to test support around the orange 50-Day MA at some point during the advance. However, so far, it doesn’t look like it will happen in the current correction. Nonetheless, as noted above, a drop below today’s low of 2,291 could accelerate that scenario. But first there is potential support around the 2,261-price area, which the 38.2% Fibonacci retracement of the bull upswing, beginning from the February 14 swing low.
For a look at all of today’s economic events, check out our economic calendar.
About the Author
Bruce Powersauthor
Bruce boasts over 20 years in financial markets, holding senior roles such as Head of Trading Strategy at Relentless 13 Capital and Corporate Advisor at Chronos Futures. A CMT® charter holder and MBA in Finance, he's a renowned analyst and media figure, appearing on 150+ TV business shows.
Did you find this article useful?
Latest news and analysis


Advertisement