Advertisement
Advertisement

Gold (XAU) Daily Forecast: Drops to $2,329; Will Trendline Break Spur Sell-off?

By:
Arslan Ali
Published: Apr 30, 2024, 05:55 GMT+00:00

Key Points:

  • Gold declines to $2,329 ahead of crucial Federal Reserve meeting on May 1-2, 2024.
  • April's PCE Index at 2.9% suggests delayed Fed rate cuts, impacting gold prices.
  • Geopolitical stability from Israel-Hamas talks shifts focus from gold to yield assets.
Gold (XAU) Daily Forecast: Drops to $2,329; Will Trendline Break Spur Sell-off?

In this article:

Market Overview

In the Asian trading session on Tuesday, Gold prices declined to $2,329 per ounce, a noticeable descent from recent highs, as market participants prepared for the U.S. Federal Reserve’s meeting set for May 1-2, 2024. This meeting is critical as it might solidify the ongoing concerns over prolonged high U.S. interest rates.

Fed’s Rate Path and Inflation Influence Gold’s Trajectory

As investors brace for the Federal Reserve’s decision, the emphasis on recent inflation data has heightened. April’s U.S. Personal Consumption Expenditures (PCE) Price Index confirmed an inflation rate of 2.9%, reinforcing expectations that the Fed may not initiate rate cuts until September 2024 at the earliest.

Fed Chair Jerome Powell is anticipated to adopt a cautious, possibly hawkish tone in light of these figures, which could enhance the U.S. dollar’s appeal and depress gold prices.

Market Dynamics and Geopolitical Effects

Despite a 4.2% increase in April, following a 3.5% rise in March, gold’s attractiveness has been compromised by stronger forecasts for the U.S. dollar and diminished safe-haven demand amid cooling Middle East tensions.

Peace talks between Israel and Hamas, alongside reduced fears of escalation with Iran, have somewhat stabilized the geopolitical landscape, shifting investor focus to more yield-bearing assets.

Upcoming Economic Indicators and Market Sentiment

Gold’s immediate future will likely hinge on further economic data and Fed guidance. Traders are eyeing the upcoming release of the Nonfarm Payrolls report and other key indicators such as the Chicago PMI and the Consumer Confidence Index due on April 30, 2024.

These metrics could provide fresh insights into economic health and influence gold market volatility.

Gold Prices Forecast

Gold - Chart
Gold – Chart

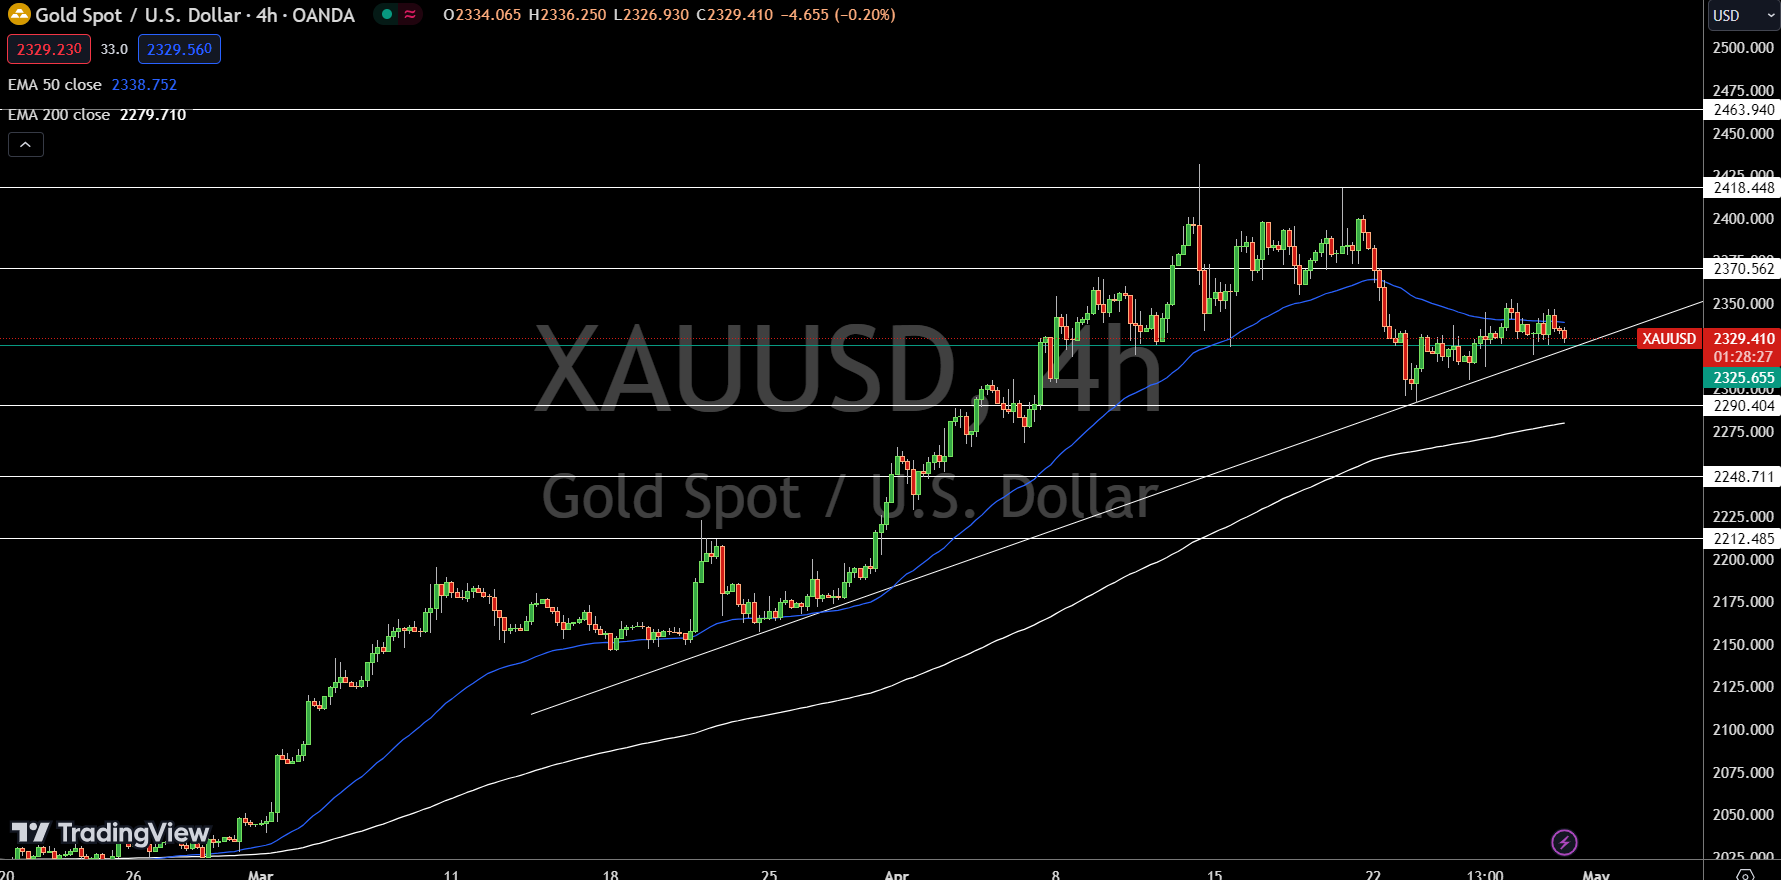
As of April 30, the price of Gold stands at $2,329, marking a decrease of 0.38%. The precious metal is currently hovering just above the pivot point of $2,325.66. Should prices fall below this level, there is a potential for a further sell-off, indicated by an earlier breakout below the $2,322 mark.

Looking ahead, resistance levels are set at $2,370.56, $2,418.45, and $2,463.94, which could limit upward movements. Conversely, support levels are found at $2,290.40, $2,248.71, and $2,212.49, providing floors that may stabilize price declines.

The 50-Day Exponential Moving Average (EMA) is at $2,338.75, suggesting some resistance just above current levels, while the 200-Day EMA at $2,279.71 supports a longer-term upward trend. The market stance is bearish below $2,325.66, with potential shifts in sentiment if gold surpasses this threshold.

About the Author

Arslan, a webinar speaker and derivatives analyst, has an MBA in Finance and MPhil in Behavioral Finance. He guides financial analysis, trading, and cryptocurrency forecasting. Expert in trading psychology and sentiment.

Did you find this article useful?

Advertisement