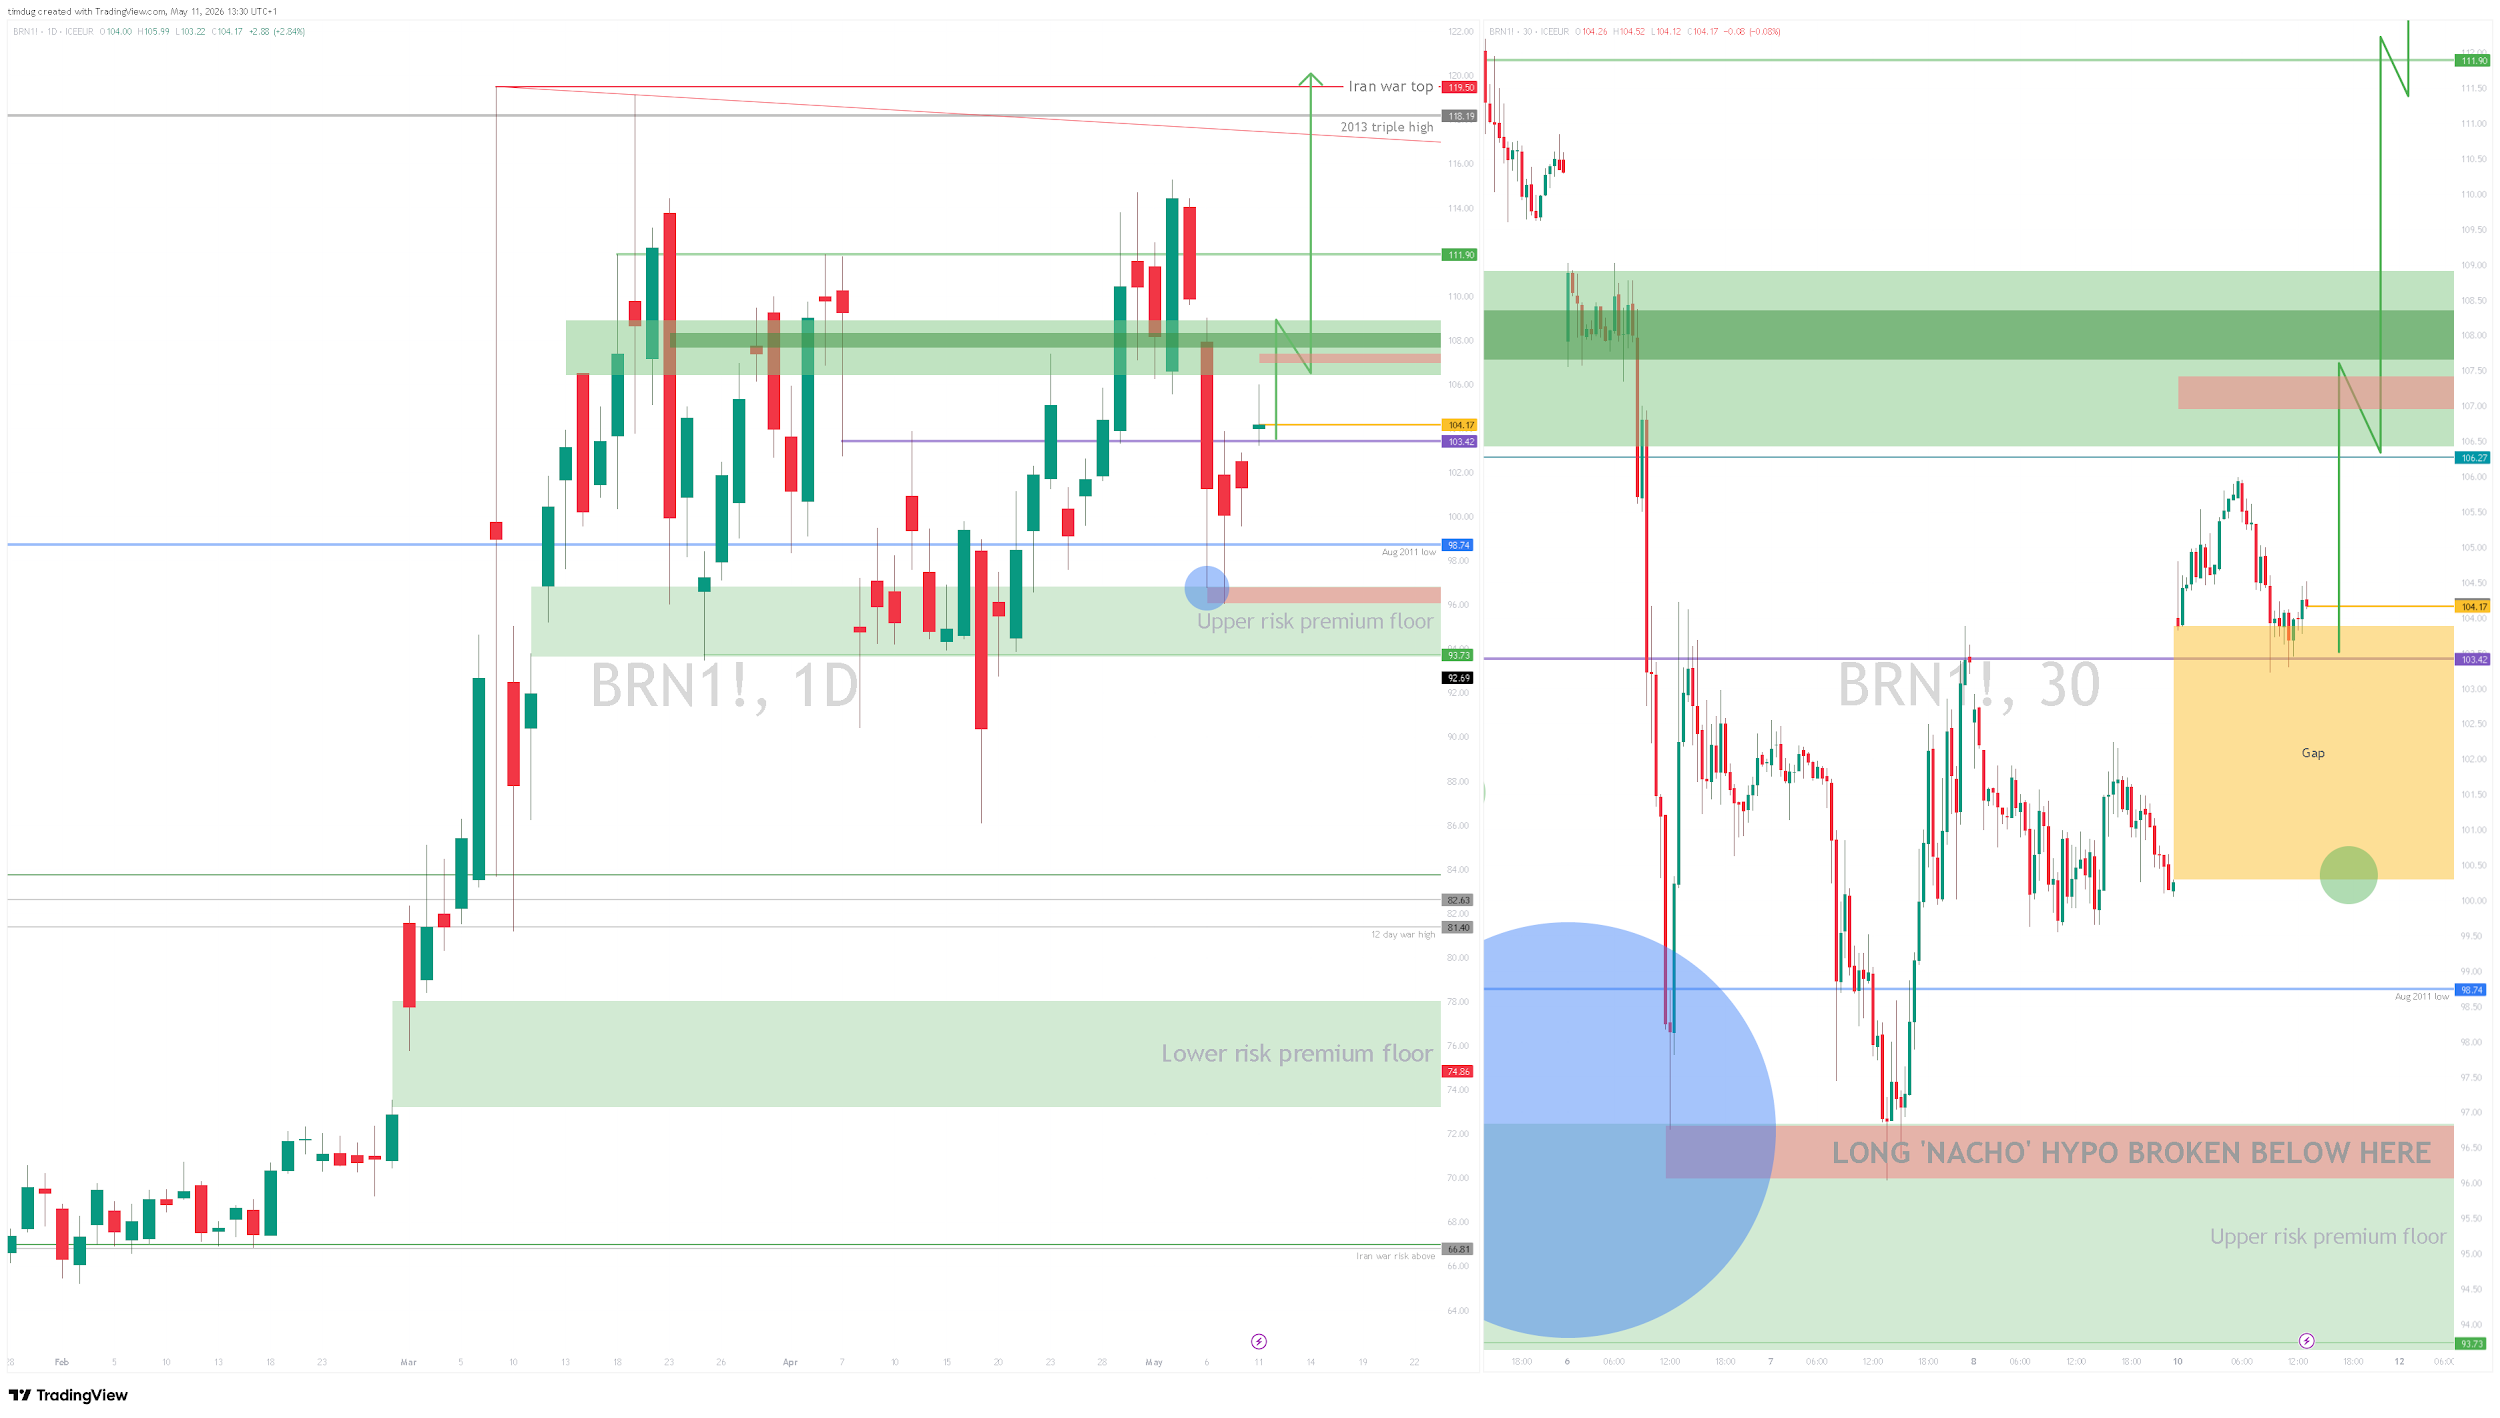
There is currently one of the biggest shifts in energy availability and pricing about to happen the world has ever seen. I hate to be sensational, but I am blown away by the complacency of government and the societal apathy we are walking through. We have seen this through the politics of US and Europe over the last 10 years. This situation is suffering from the same apathy. The emergency that is ignored becomes the emergency we all just live with.
But let me save the vitriol for another post some day. We are here to focus on oil, energy and what’s coming.
There is so much news flow noise to be aware of, I try to distill this each week to what is the most important set of elements to be mindful of. But there are really only 2 points to know.
- The entire world is sleep-walking into a critical energy doom window June 1st through September 30th.
- There will not be a return to normal. WE ARE IN THE NEW NORMAL. And its higher oil prices for longer.
Iran’s Peace Deal Response
In response to the US peace deal, Iran said the US deal must end the war and trigger 30-day talks. It stated Hormuz control and a Lebanon ceasefire are red lines, as well as demanded an end to oil sanctions and asset release. Trump has stated that Iran’s peace deal response is ‘‘Totally unacceptable’’. Either which way, Iran hold the cards and have stated what they want. In addition, they seek funds from The US for war damages amongst other requests.
US Marines are running boarding drills. Iran’s National Security Commission is threatening to sink US destroyers. The UK is deploying a warship. The UK and France are convening defence ministers from dozens of countries on Tuesday. Talks may resume in Islamabad next week. The military posture says nobody is positioned for them to land.
Recap on Last Week
I normally don’t like doing full recaps of prior weeks, but last week was key. The NACHO trade (Not Any Chance Hormuz Opens) was in full effect Tuesday. The White House desperation got to fever point, where Axios news were leaked a proposed 1 page peace deal document. Rubio announced that ‘‘The war is over’’.
The document was to provide a 30-day window for negotiations, where traffic would resume through The SOH during this time. The market sold down approx 10% in violent fashion. This sparked another SEC flag on a block trade. There was a long setup to fade all this in the making. There was zero chance this is over.
Brent Oil Price Forecast
Every new Brent Oil analysis as it publishes, today's technical signal and key levels, live price — on one page.
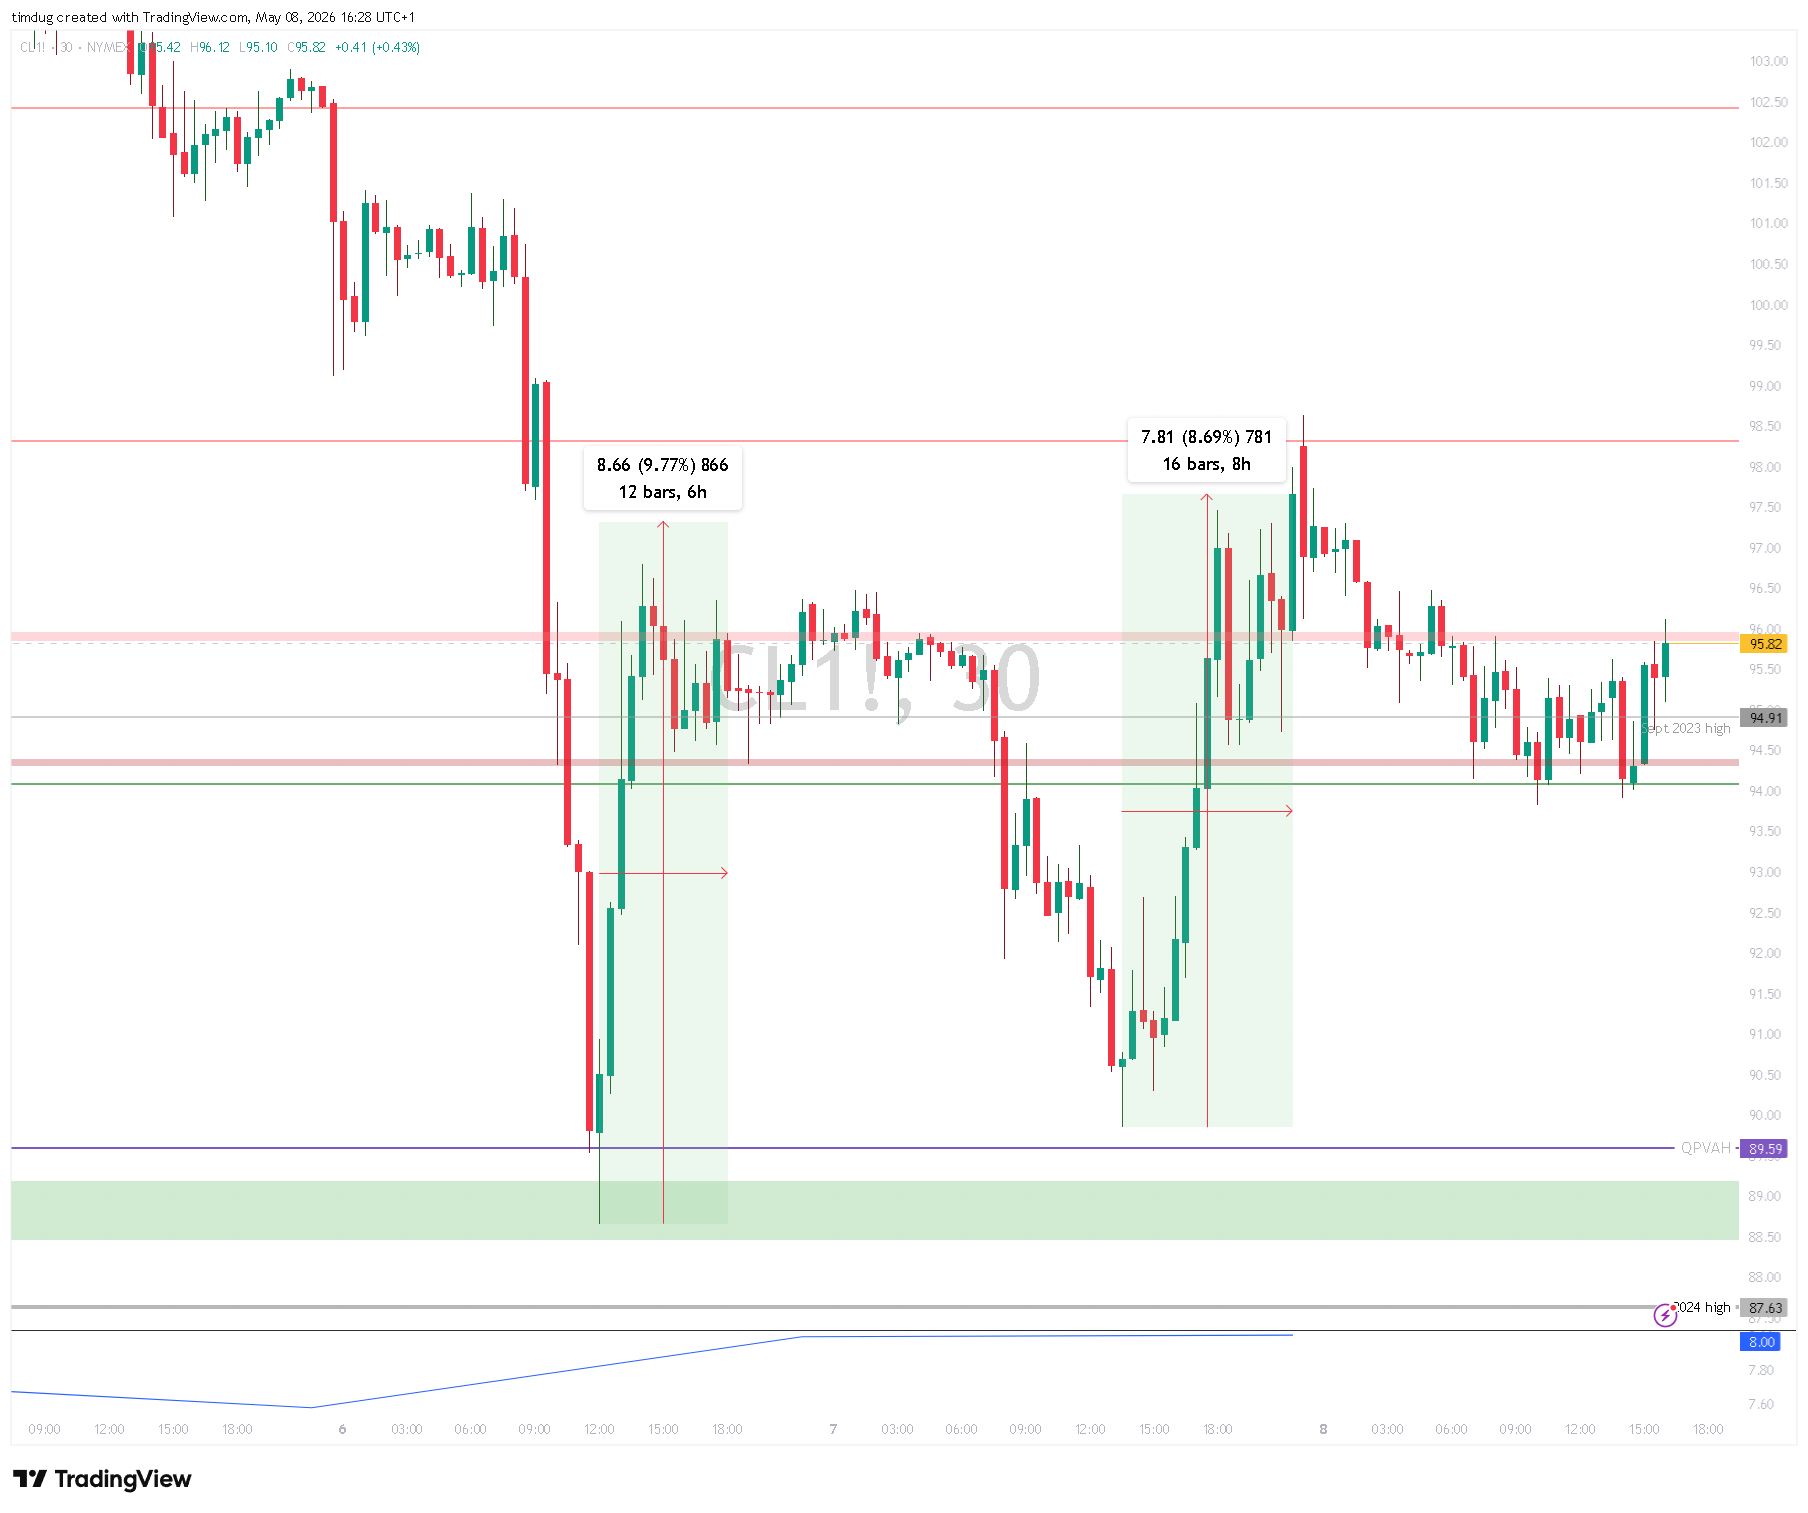
See all Brent Oil forecastsThe NACHO trade is simply this-no matter what comes out from the US administration, if it is not immediately agreed publicly by Iran, it can be considered a fade. This was no exception. Wednesday, they came in to sell the market again, with buyers holding the line. In the middle of this selling, Trump then paused Project Freedom, the US operation to escort tankers through the Strait. This was good for a $7 move back up from the lows. Then Thursday, the icing was put on the fade cake-
Iranian FM Baghaei says proposal “still under review“.
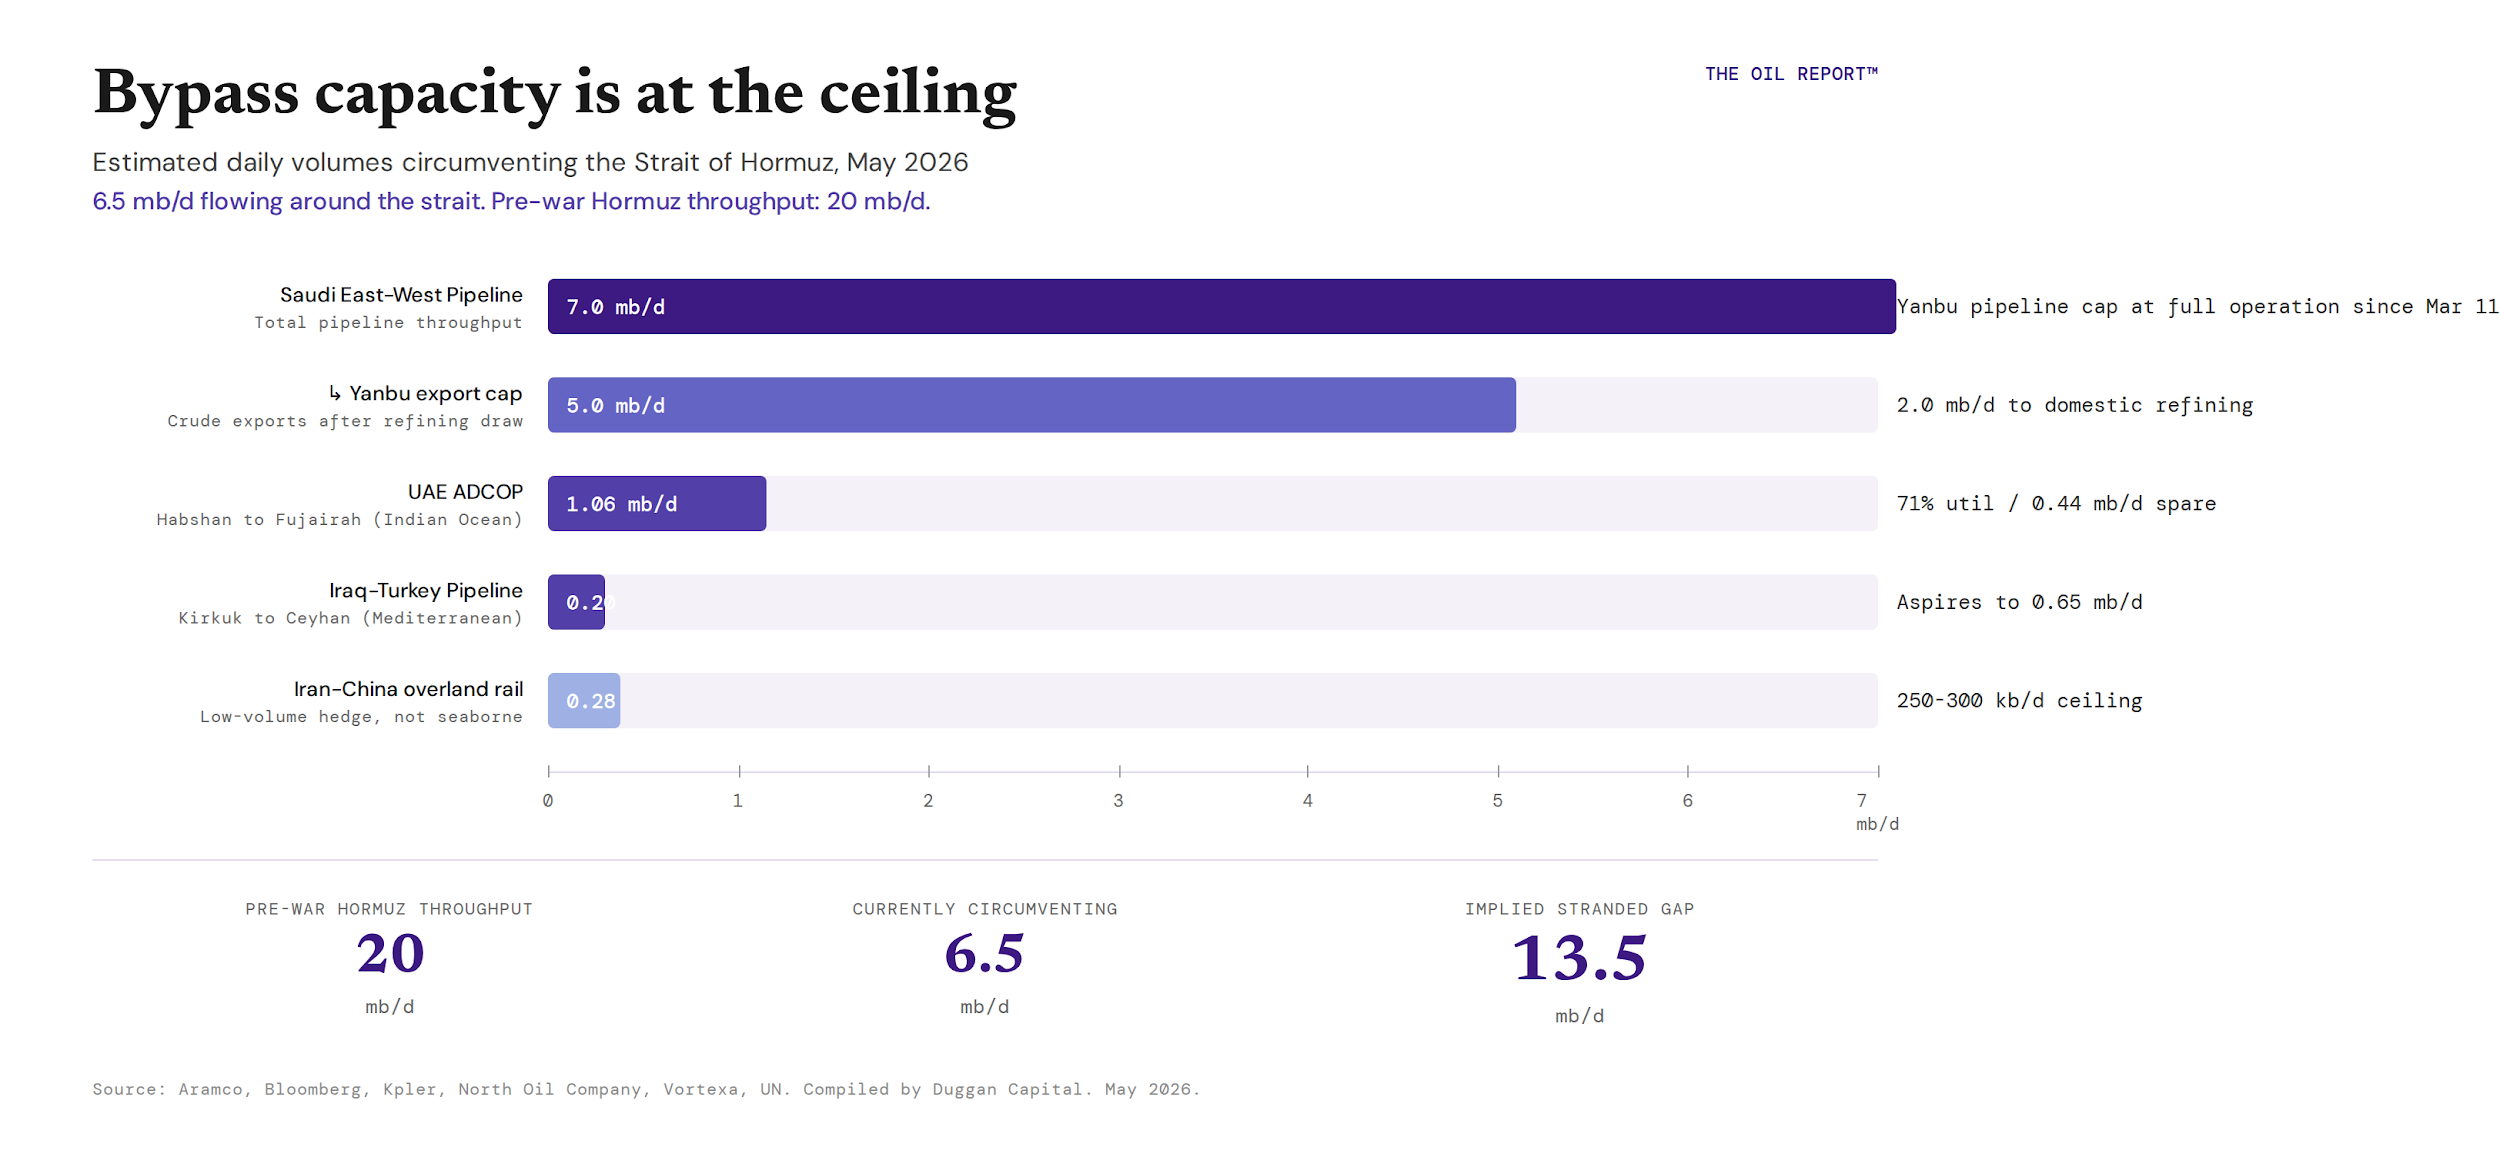
The “13mbpd Gap” New Normal
There is a mental model that we will adjust to now, while the market does it for us. The current state IS the new normal, or very close to it. Iran has already set up a state agency to collect tolls in the SOH. The Persian Gulf Strait Authority. News of which has been strangely lacking on any major news channels. You won’t read about this in CNN, FOX etc. Just another cut in the weeping Petrodollar wound.
Prepare for DXY to weaken further – currently trading flat YTD. Remember, if you make 3% on equities’ portfolio, but DXY loses 3%, you are flat gross of fees. If you are European, and your US equity positions are up 3%, but EUR/USD is also up 3%, you are also flat gross of fees.
Any new pipeline to bring more back online would be a 2-5yr build. If there are small tolls to pay, rather than invest a chunk of money, the market will absorb the new toll pricing. This means that 10%+ of global oil has a new tariff. That will be priced into all the barrels going forward. So this is why sub $80 is too cheap.
Records, Cliffs and the $80 Floor
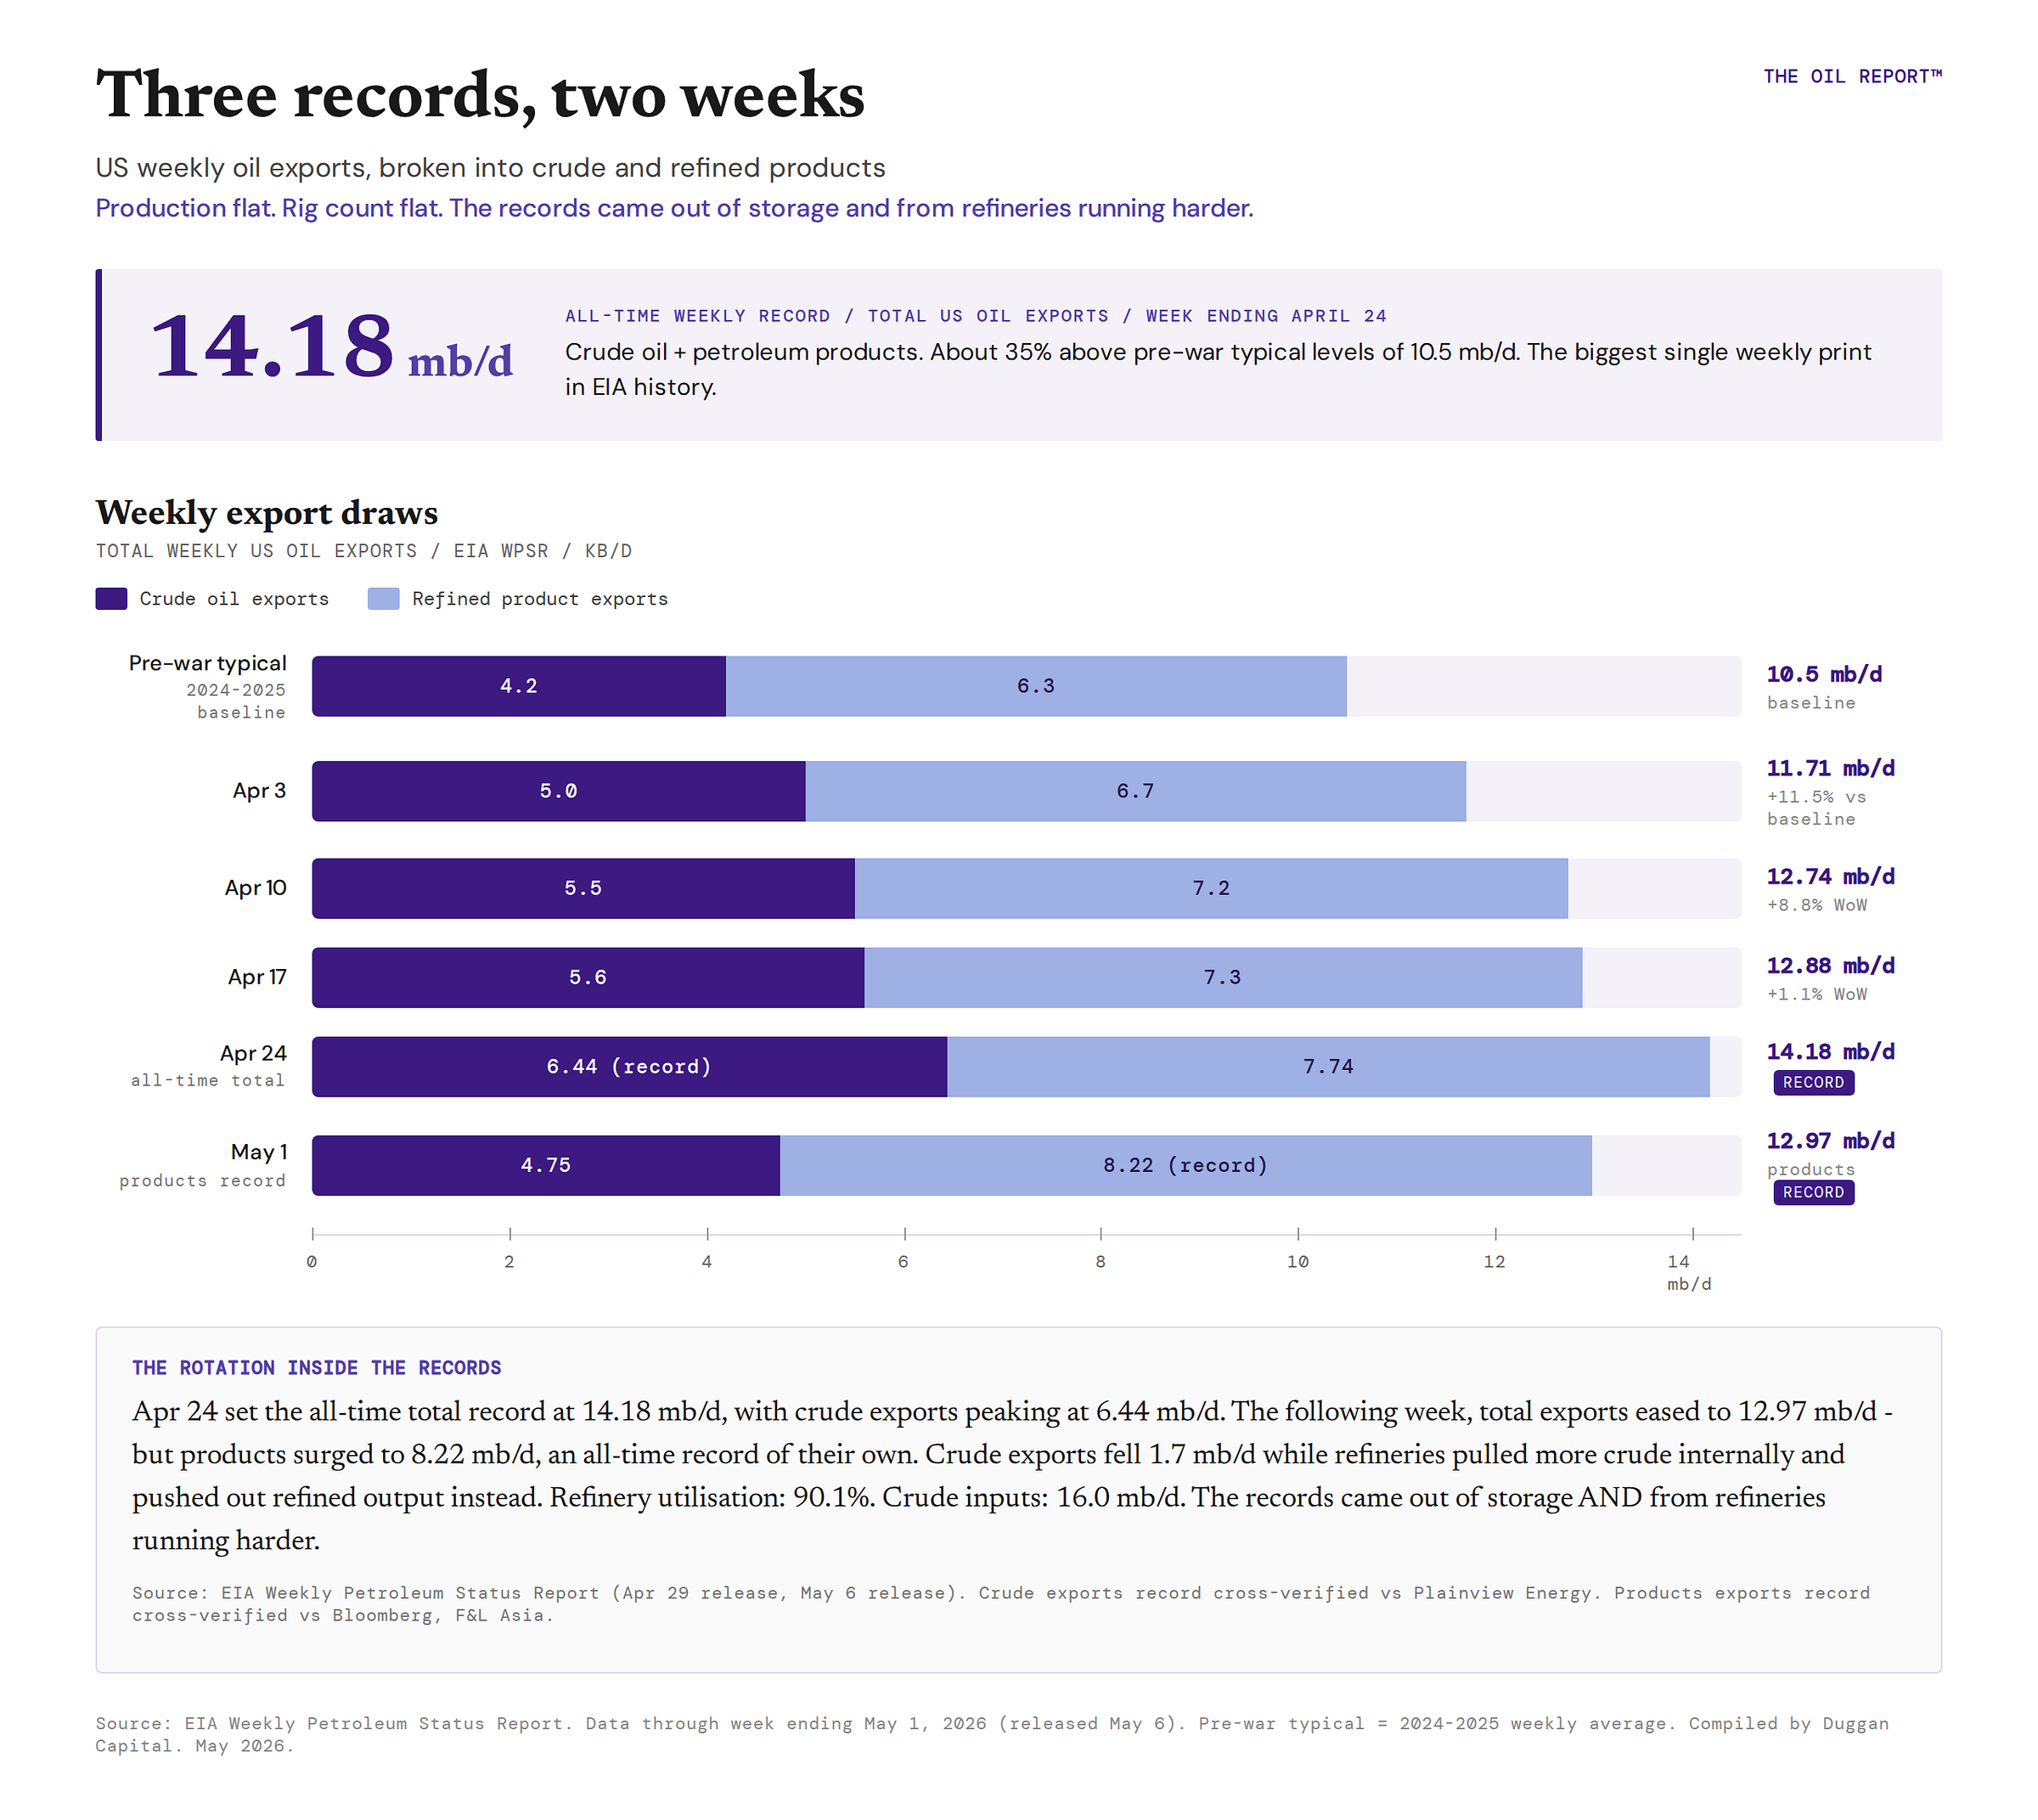
Headlines sold the war as over this week. Price moved the other way. The US drew a record 7.1 million barrels from the SPR. It exported a record 6.4 million barrels per day of crude two weeks ago. Then drew another 5.2 million from the SPR and shipped a record 8.2 million barrels per day of products last week. Production flat. Rig count flat. Five major institutions are now telling the same story-operational floors hit somewhere in the next two to six weeks. And $80 WTI is the policy floor everyone is dancing around. Operators need to know which side of $90 floor they’re betting on.
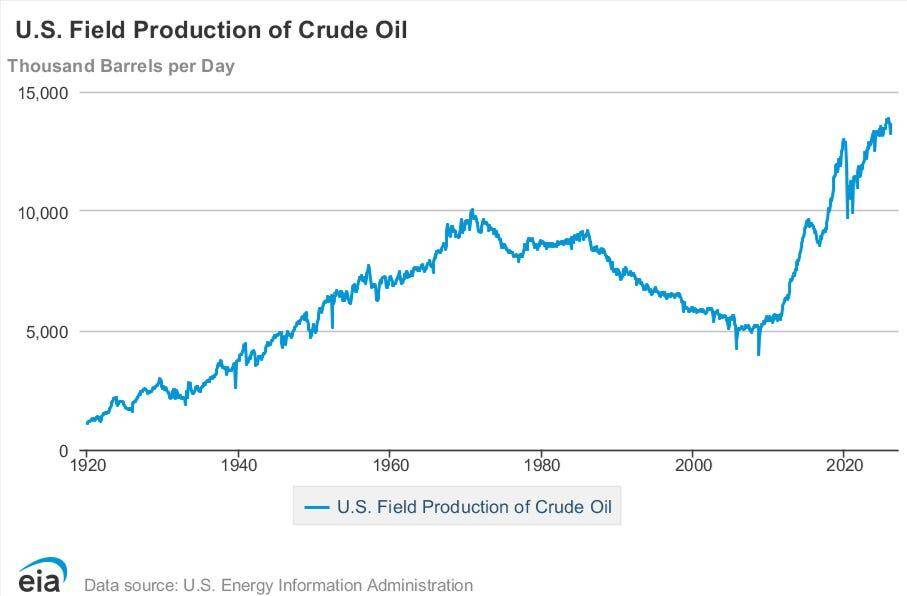
The US SPR as of May 1st has 392.7mb, with 22.5mb cumulative drawn since March 20th. Exports are hitting records week over week. There is a growing chat that the US will soon get to a point on crude and distillates export bans. I would rather not get ahead of that actually happening, but I do see that there is nothing but a tailwind for producers, refiners, and everyone in between. Interesting to note the shift WOW as of last EIA data May 1st, that the profile of exports has shifted to refined products 8.22mb with crude oil only 4.75. Interesting to track this going forward, as products, not crude, will take more share.
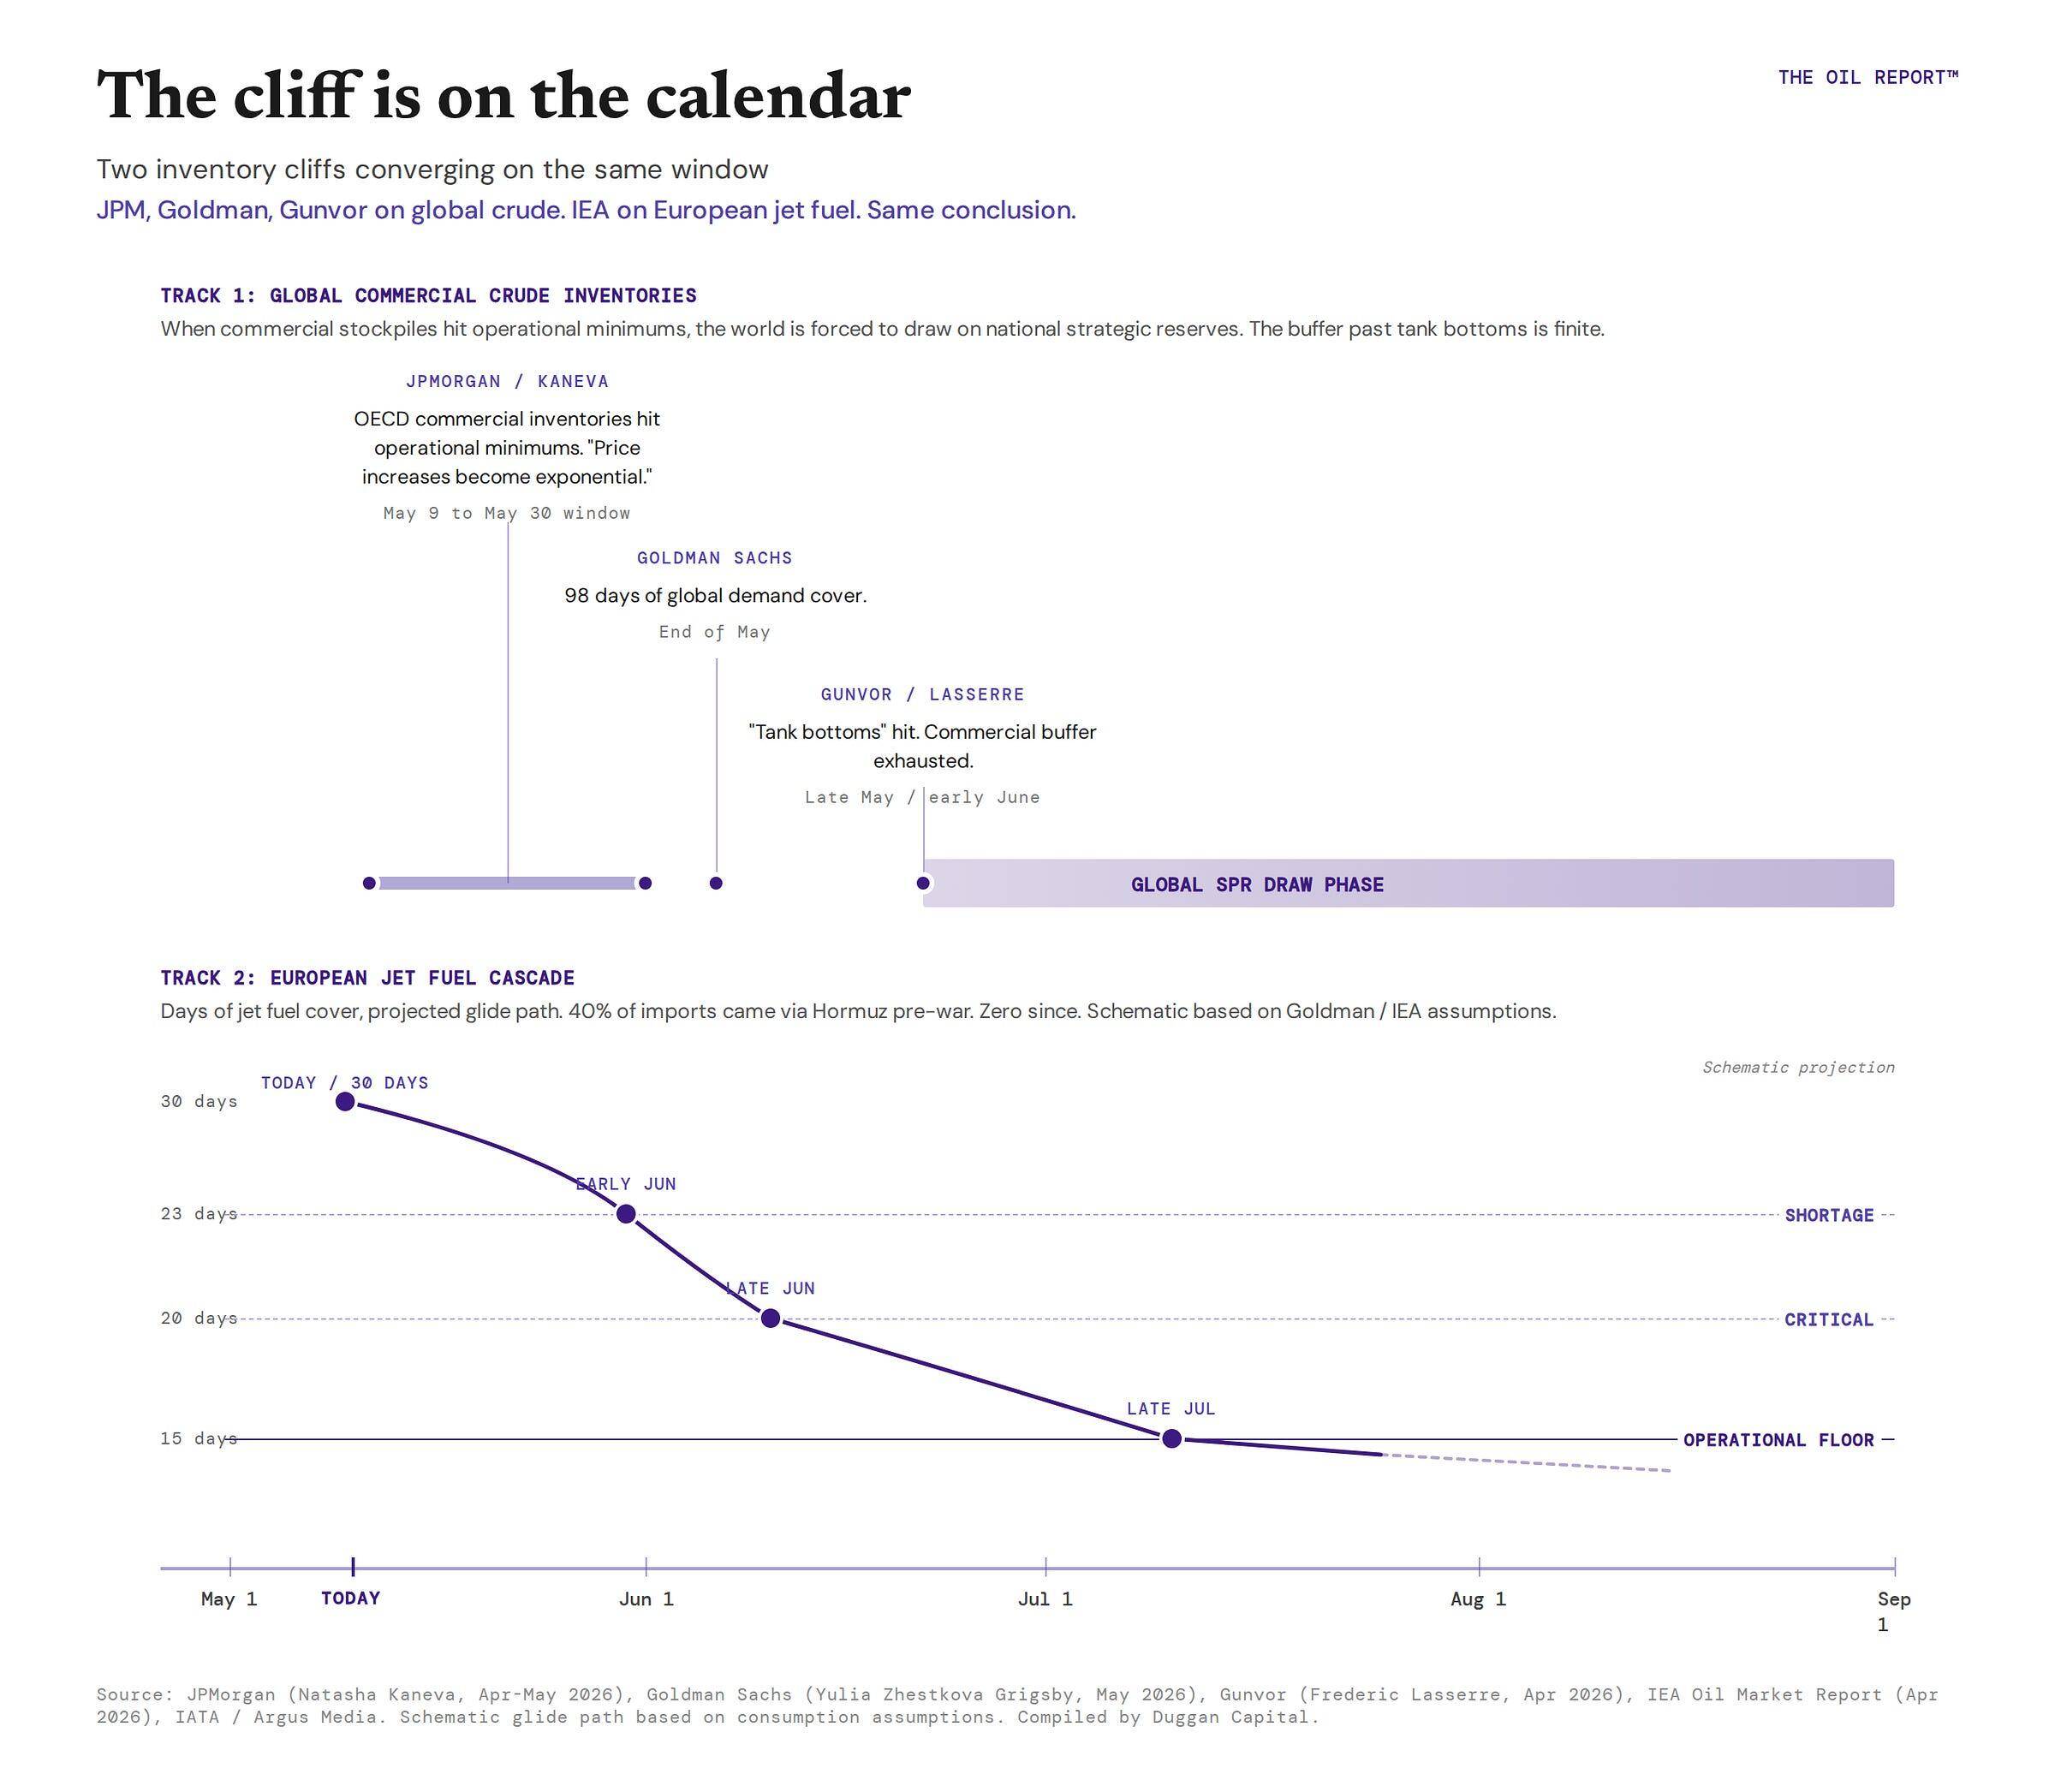
J.P. Morgan is pressing the point hard on these timeline cliffs at the moment. What I’m referring to as ‘The Doom Window’. Nice to add a bit of drama! But my point here is that we really do have a simple view of the gravity of the situation. I salute JPM for their ‘true’ coverage. They are taking the high road, unlike Goldman who are pushing fantasy scenarios. So in the chart below, note that once we get to early June, we are into a 90 day window where we start to significantly draw on SPRs. The trouble as JPMs Kaneva noted, is that we cant really go drawing these down that much; otherwise there becomes a problem with how they actually, mechanically and physically work. Minimum pressures, flow rates, quality of oil degrades the more you dip in etc.
The Gulf Is No Longer One Block
The Gulf is in disarray. The UAE left OPEC after 58 years on May 1. They were too constrained on production from OPEC, and their fellow OPEC member Iran bombing them was too much. This is not a procedural disagreement over quotas. It is a sovereign break from the price discipline that held the Gulf together since 1968. Post-OPEC, the UAE can ramp four to five million barrels per day unconstrained.
Israel have transferred operational Iron Dome to the UAE during the war, its first foreign deployment ever. This is probably the largest crack in the MENA window. Saudi did not retaliate against Iran, lobbied against further escalation, and remains publicly opposed to alignment with Israel. So, to speak to the title of this article-no, we will not return to normal ever again. We all need to get over that and stop looking at where we think the ball is going and start to accept where the ball is! Price action last week confirmed this is now the way!
The Fallout
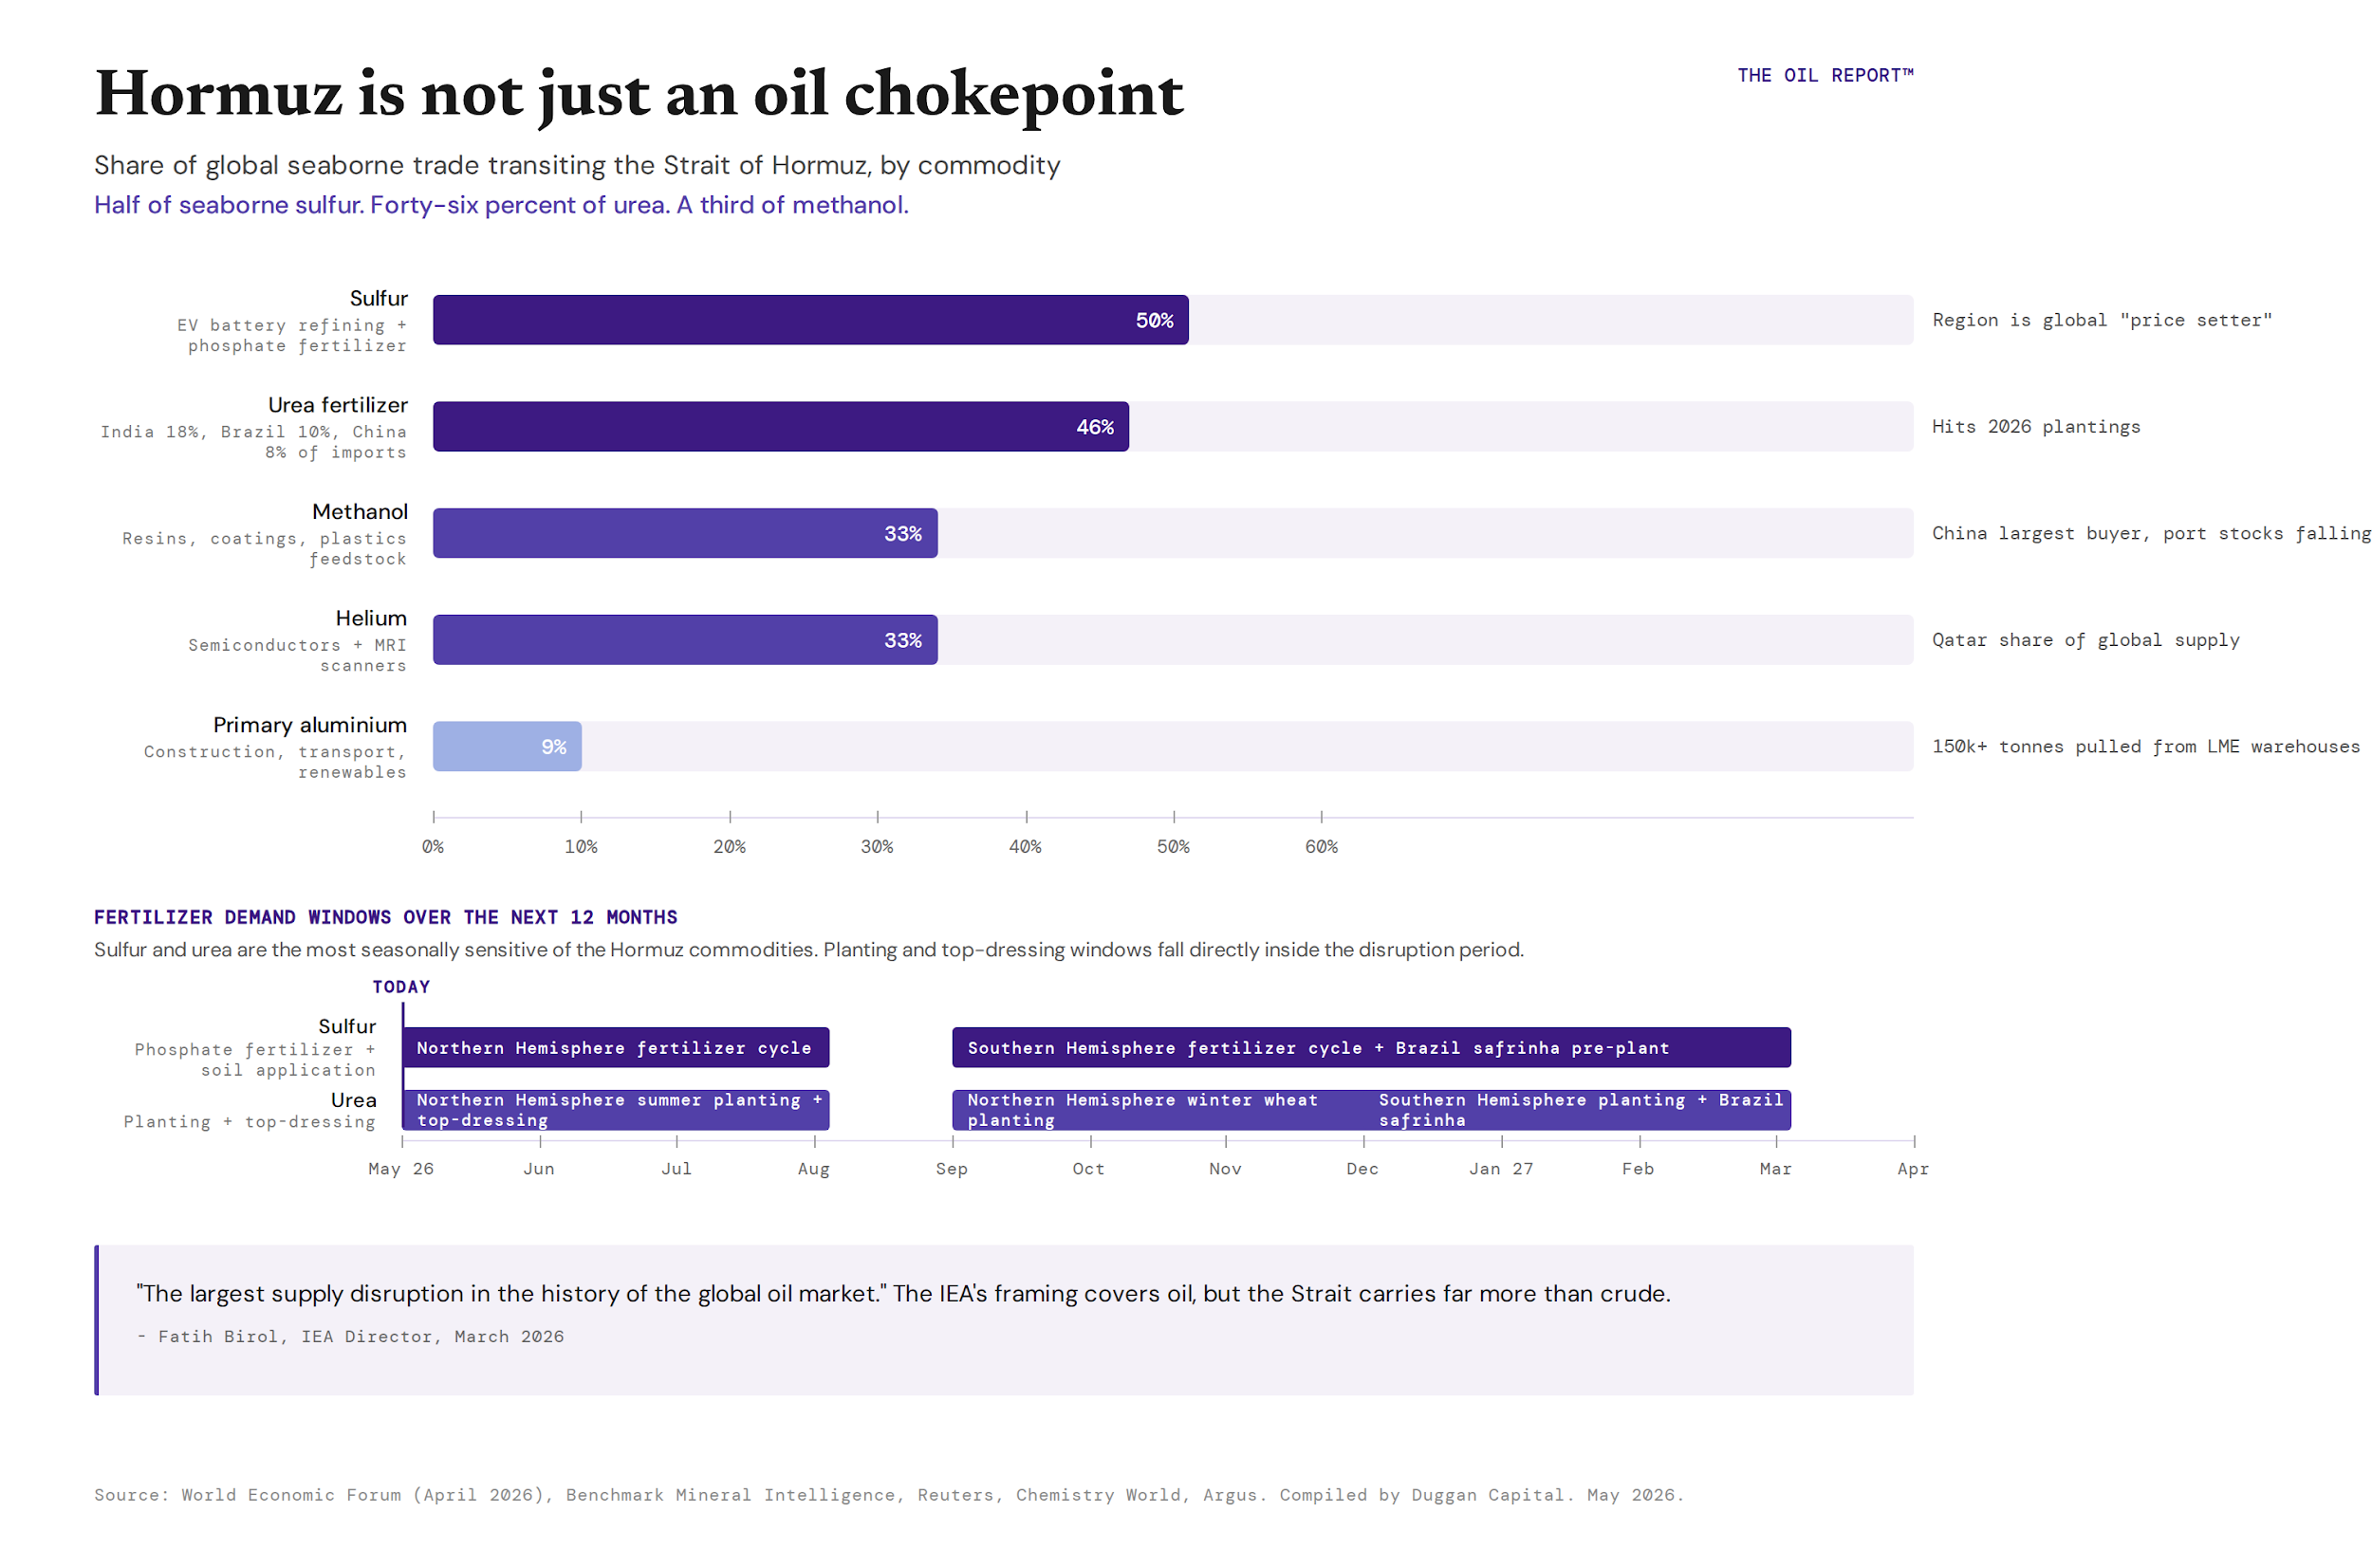
This is the big one that’s in the post. While certainly in Europe most farmers have made their planting window, the prices of fertilizer are certainly up. This then affects the crop topping windows this summer in the Northern Hemisphere. There are government meetings here in Ireland on buying forward the 2027 stocks. Farmers are worried about the next 6 months. It’s interesting from my perspective that farmers here are taking the stance that they should not be asked to buy forward stock. That this should be the role of the brokers and traders. This then raises the role of the speculator. This is where the government should step in and take the speculation position. Otherwise, private traders/ speculators from big to small should take that speculation. A significant capital outlay, but 100% required.
Here is a podcast from The Farmers Journal here in Ireland. A stalwart farming publication for the last 80+ years. Have a listen to the first 12mins- to get a farming impact view that is probably shared across the Northern Hemisphere.
There will be the obvious switch to organic fertilizers, where farmers use slurry and other materials they have naturally on the farm, but this can only get them so far, with farming bodies already seeing poorer grass qualities.
The Pattern
As some of you know, internally we have been working on a large C.O.T analysis model for the past year. Earlier this year in Jan, I identified with the system that we would rally hard from a specs short puke. Read the COT section from Squeeze Now! Jan 11th 2026. Basically, it was a mega long signal with a projected minimum $24 upside rip. We got that, and another $40 on top. Note: the market moved straight up for $8.78 (14%) before war broke out.
When I ran the data last Friday on the data release, I got a new pattern signal. Here is what the system found.
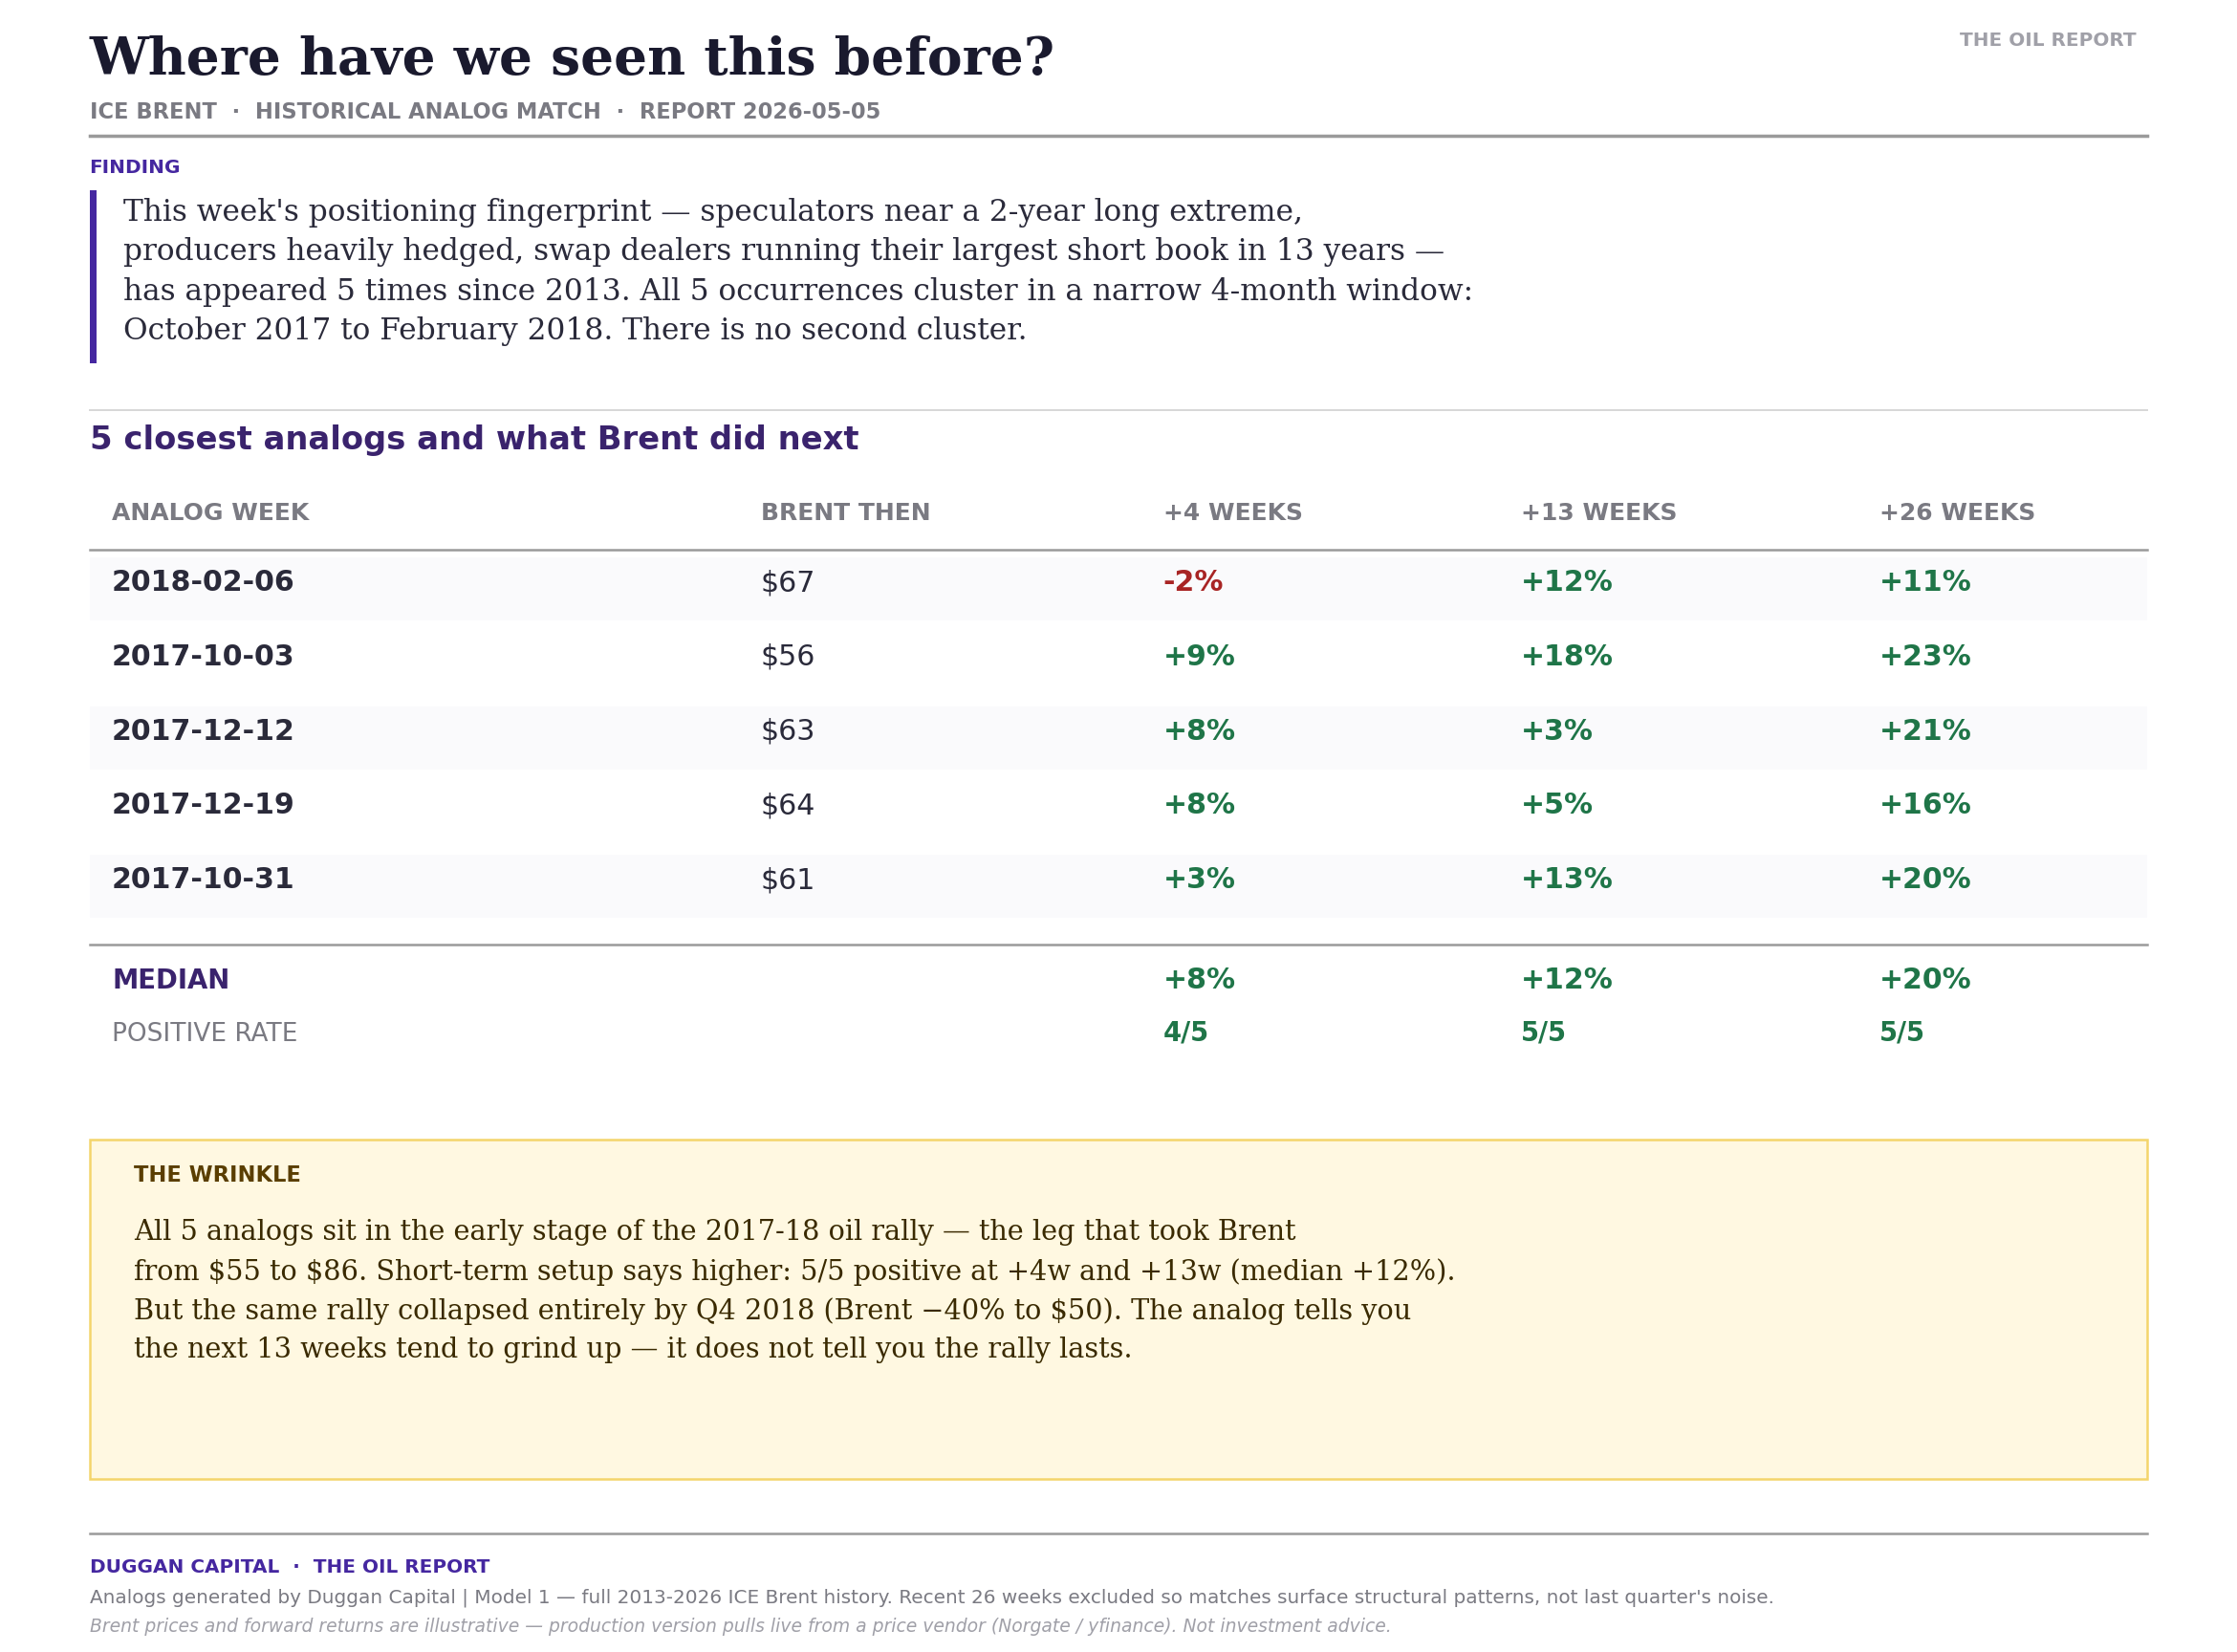
Matched against 5 prior occurrences of the same COT pattern. See the price reaction on each of those 5 times.
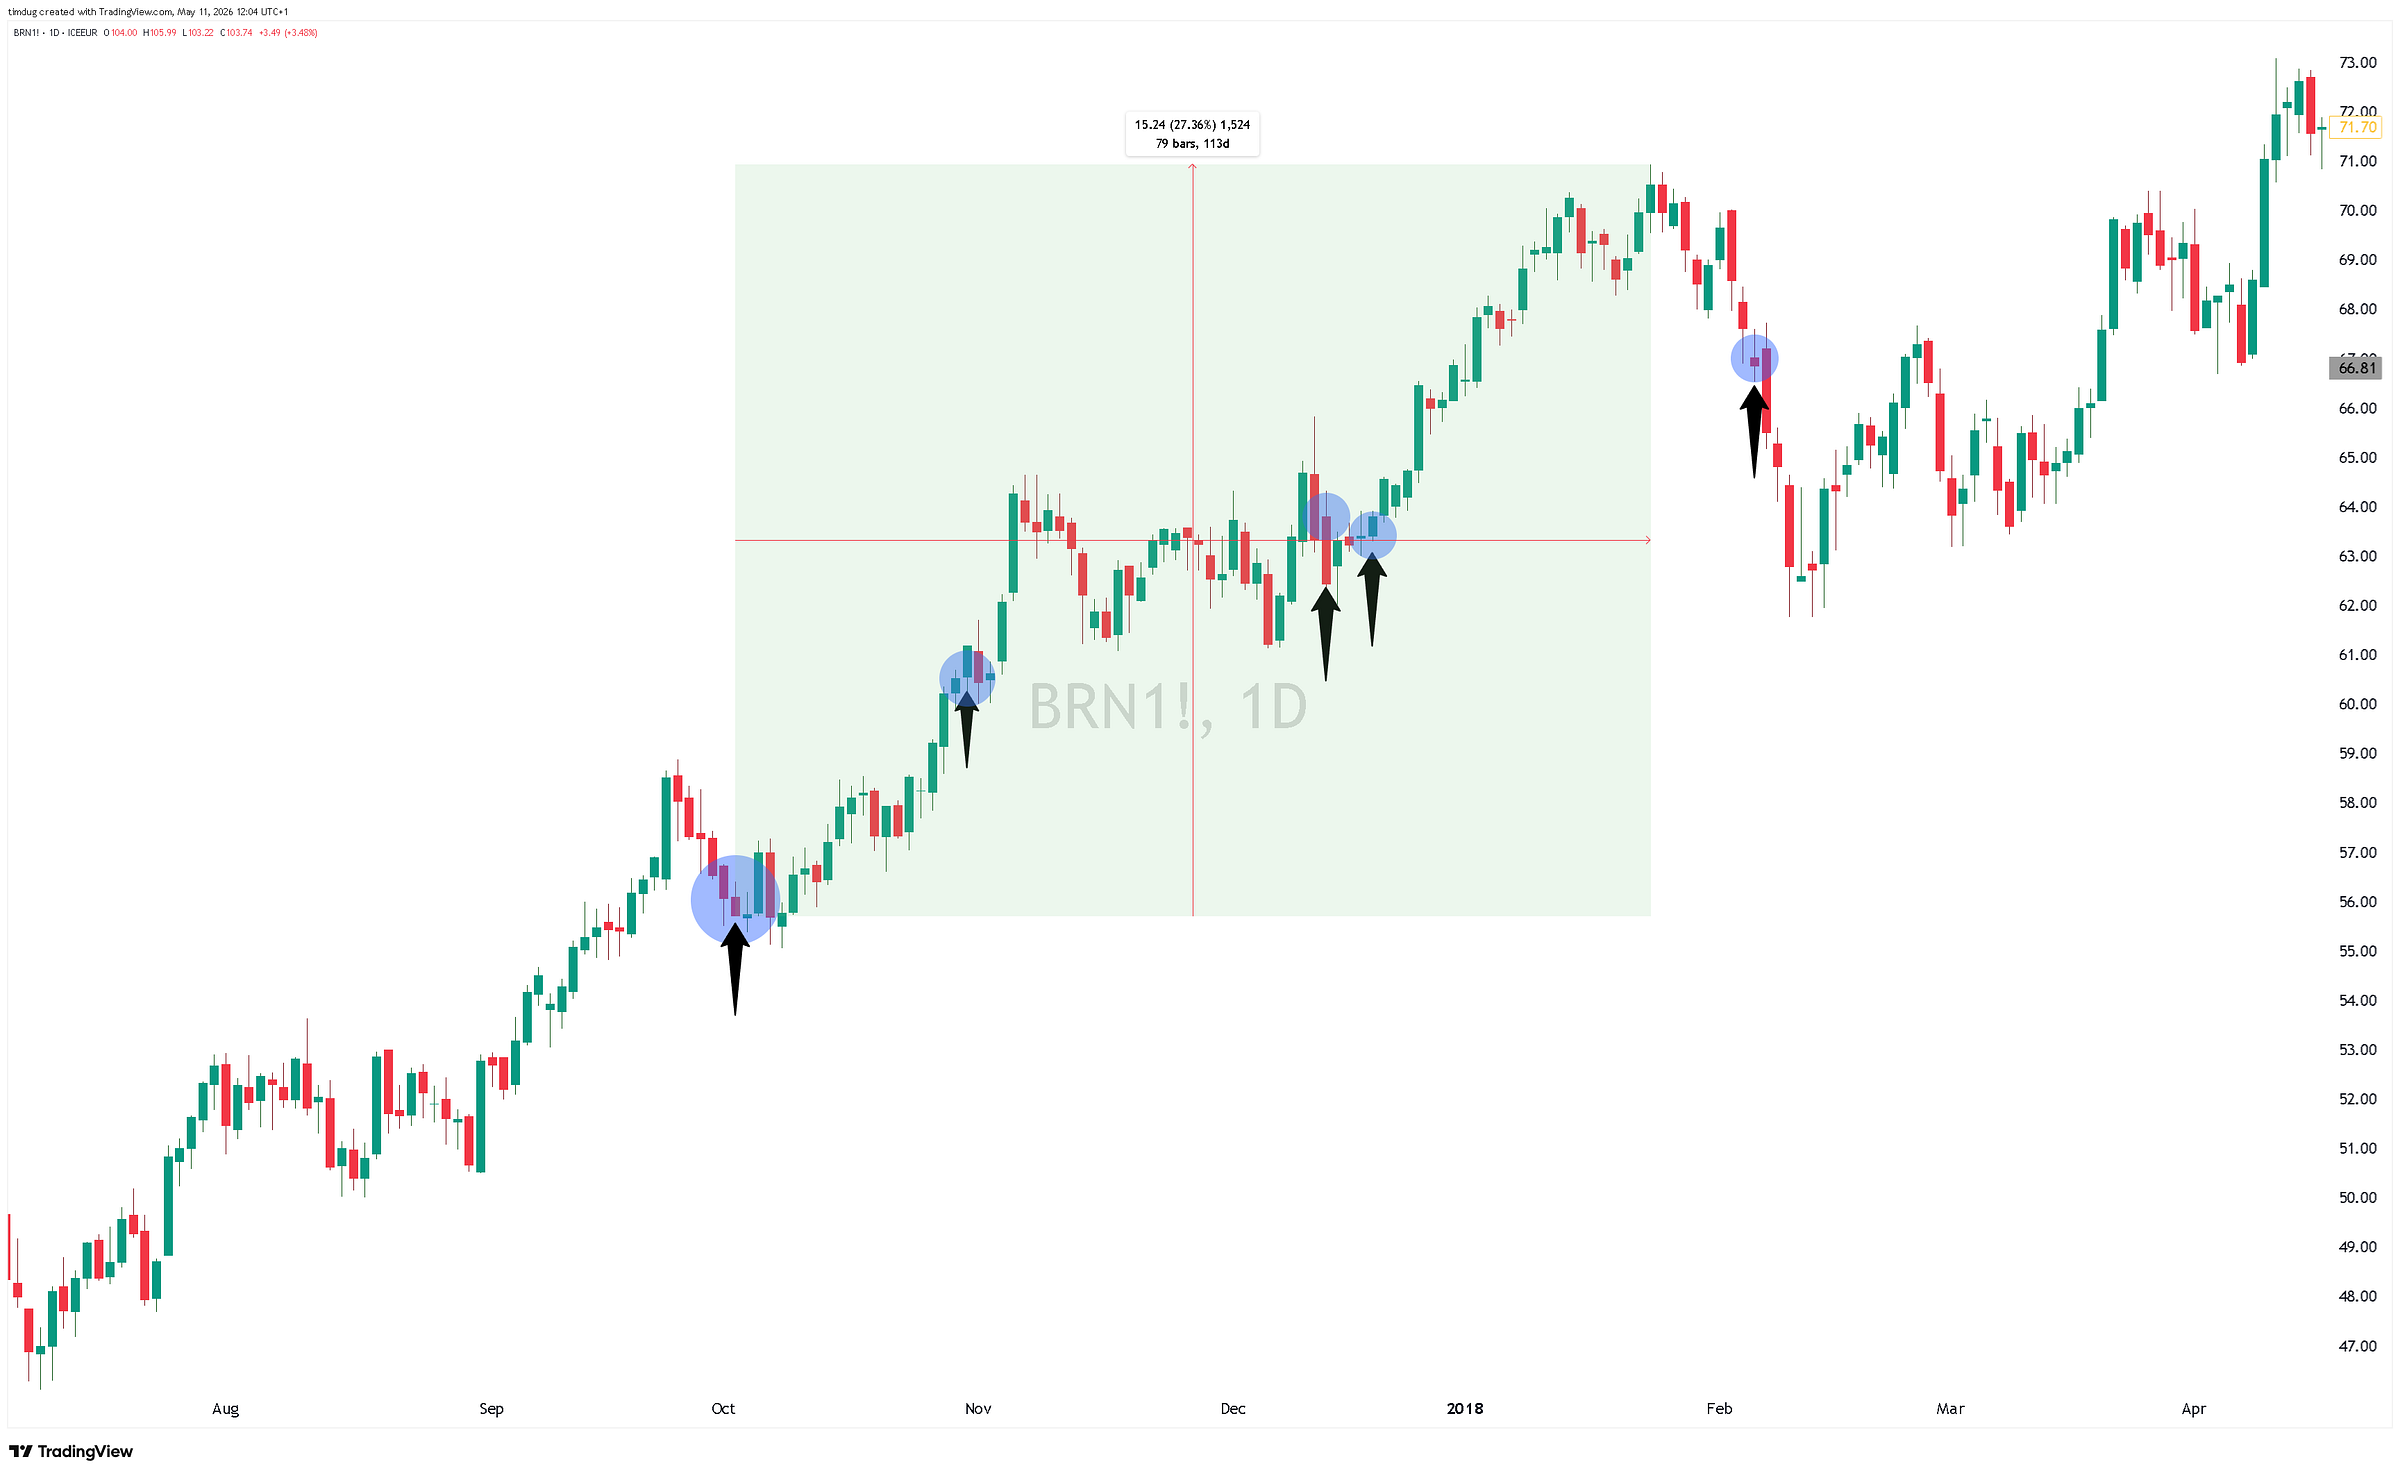
When I ran Friday’s release through Model 1 (proprietary out of 8 models), it surfaced something the previous weeks hadn’t shown: the current positioning configuration has appeared exactly five times since 2013. ALL five sit in a narrow four-month window,from October 2017 to February 2018. There is no second cluster.
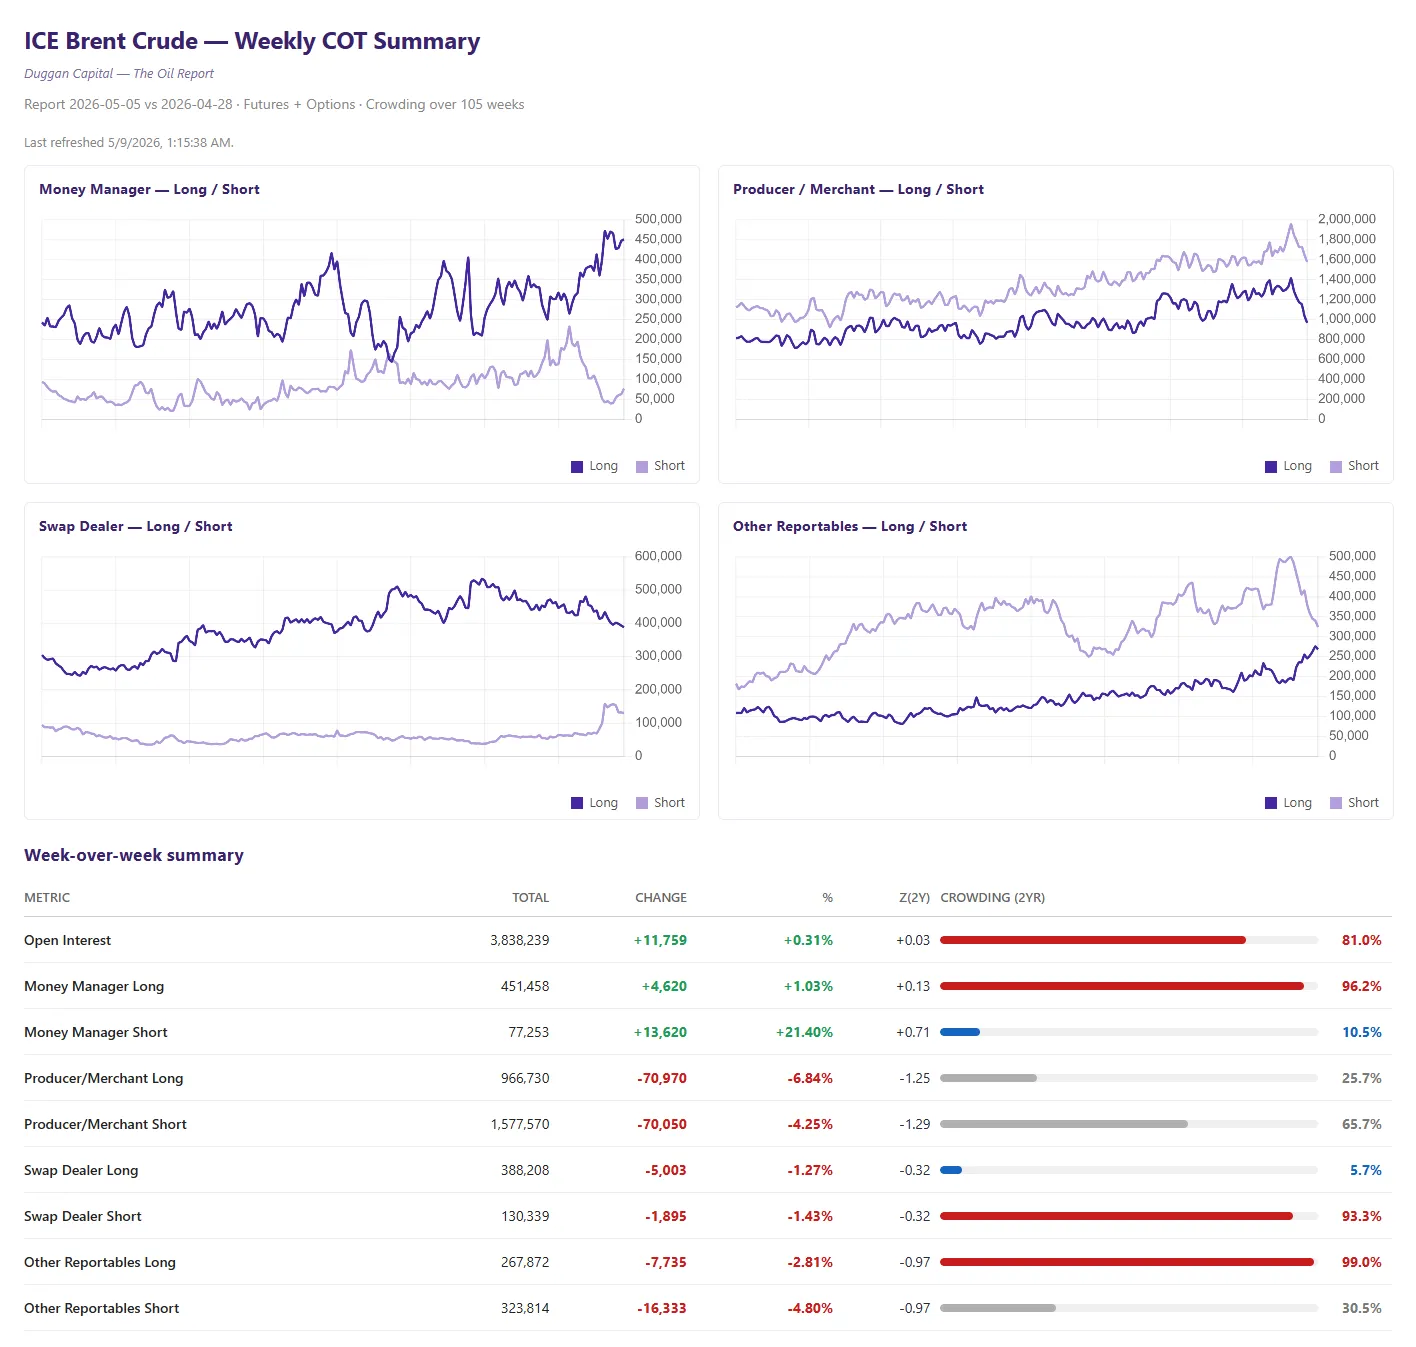
Here’s the pattern in plain English. Producers and merchants are heavily short, locking in today’s prices for future production. The swap dealers in the middle are absorbing all that hedging flow with the largest short book they’ve ever carried. And the speculators – hedge funds and money managers – are crowded long against both. Three groups at extremes, pulling against each other.
This is what late-stage oil rallies look like. I am not rushing to say this is late stage, however, given the geopolitical climate the machine learning is not fully ‘aware’ of. So I think we are mid-stage rally still. Just with an exceptional historical event the machine learning has never seen.
End-users have stopped chasing the move and started buying downside insurance. The trend-followers are heavily running their long positions. They’re still adding longs into the strength.
The match isn’t lost. Across the nine cohort measures Model 1 tracks, today sits inside the analogue band on every single one – and the fingerprint is tighter than 82% of every week since 2013. Two of the cohorts are actually more extreme today than the 2017-18 average. Same setup, higher pressure.
NET NET- I have a short-term signal at 75% confidence for longs for the next 4-13 weeks, then the signal degrades to 30% confidence.
Commitment Of Traders Report
What’s the Next Move?
The Inflation Hedge
A little bonus for any oil traders out there. The relationship between the Germany 2yr Bond is extremely tight at the moment. This is all related to inflation expectations. Many banks hedge inflation risk through oil futures. Headline inflation change is mostly driven by energy and food price change.
We can clearly see inflation is now starting to track in a self perpetuation loop. Traders are pretty much, point for point, pricing in oil inflation hedges via short-term bonds. Meanwhile equities have COMPLETELY decoupled from reality.
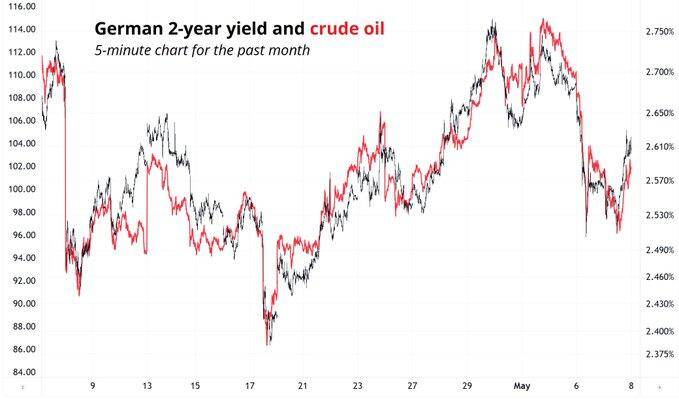
Source: Another commodity guy on X.com
I see the upside 75% more probable than downside under the current macro posture. This can change on a dime. There will be EXTREME price turbulence over the next 4 to 8 weeks. What we have covered above will stand you and me in good stead through this period. Remember, the emergency that is ignored becomes the emergency we all just live with.