


Debt has always been an essential component of the modern financial system. Borrowing enables businesses to invest, consumers to spend, and financiers to amplify returns. Yet when markets become overly dependent on leverage, the very force that fuels gains can ultimately become the catalyst for severe declines.
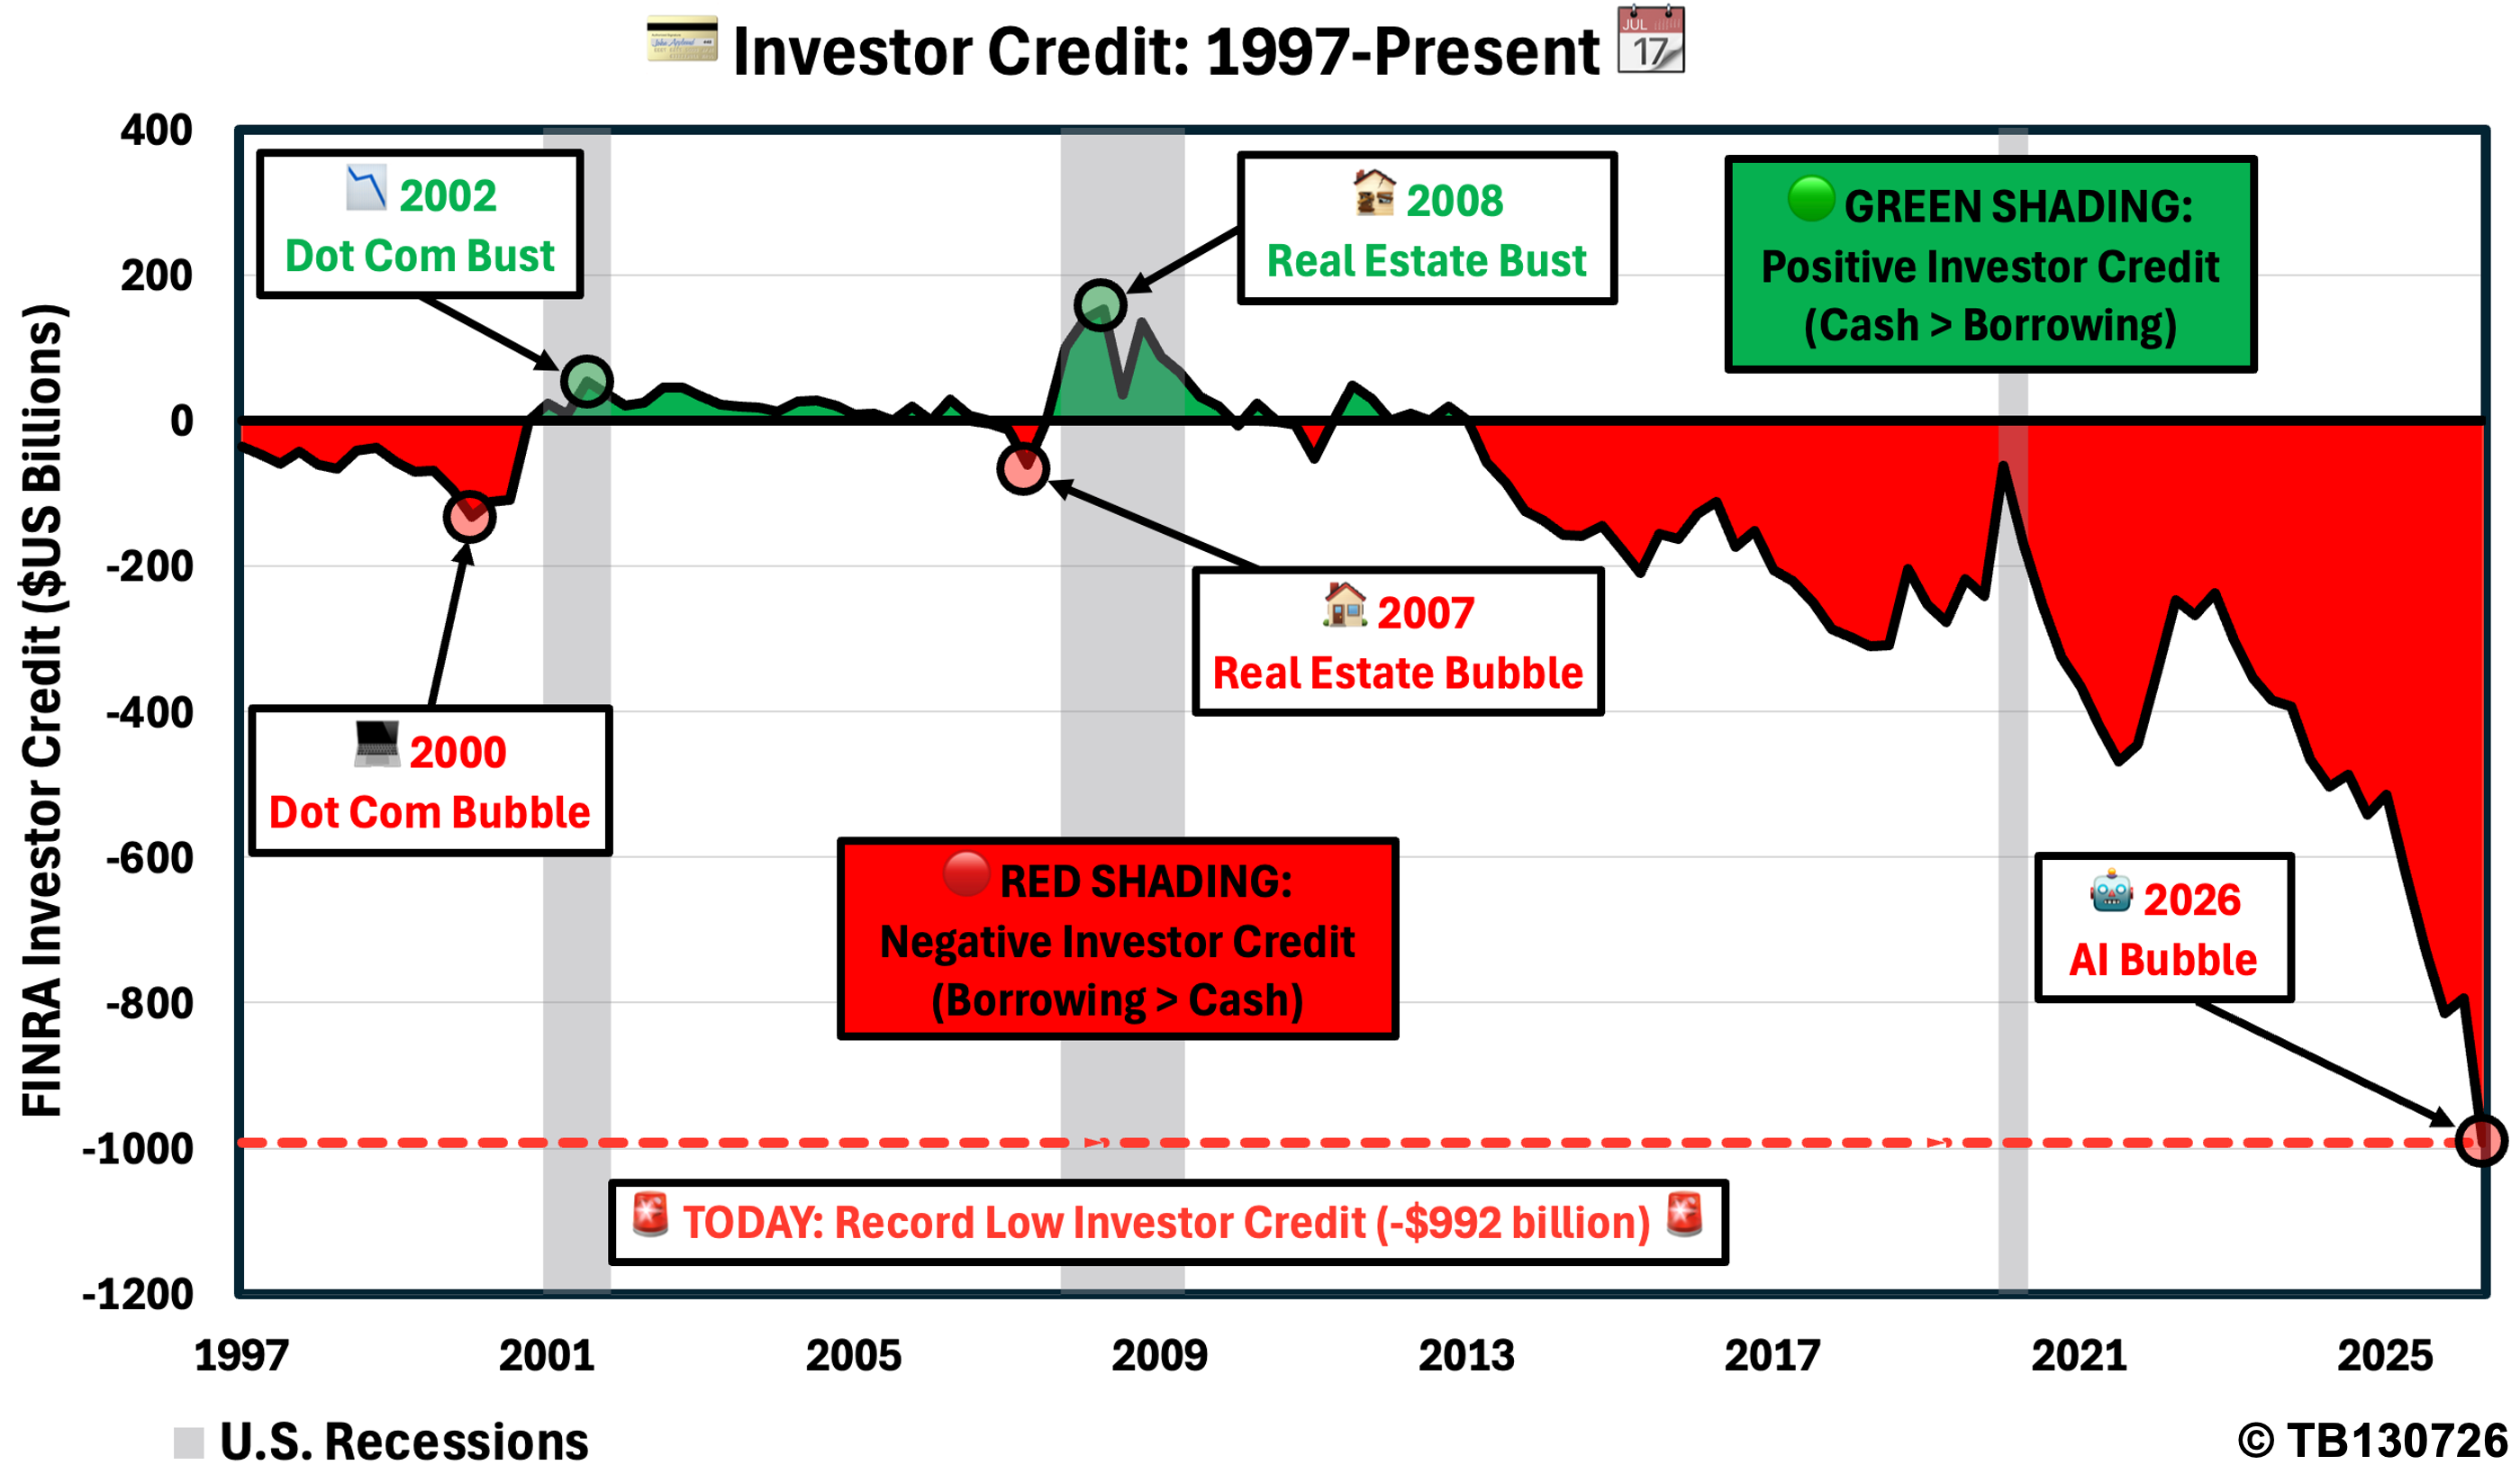
In the second quarter of 2026, investor credit fell to a record -$992 billion, representing an extraordinary deterioration of $745 billion over the past four years. Viewed in isolation, the number is remarkable. Viewed alongside previous market cycles, it becomes potentially far more significant.
Could this unprecedented plunge in investor credit represent one of the biggest threats facing U.S. equities today? More importantly, could the AI-driven market boom eventually collide with a brutal reality check once the debt-fuelled speculation cycle finally reverses?
Understanding Investor Credit
Investor credit measures the difference between the cash investors hold in brokerage accounts and the amount they have borrowed to purchase equities. When investor credit is negative, investors collectively owe more through margin borrowing than they hold in available cash balances. In practical terms, it indicates that a greater portion of market exposure is being financed through borrowed capital rather than investor funds.
Extreme levels of investor credit are often associated with periods of elevated risk appetite. As asset prices rise, investors become more willing to increase exposure through leverage, allowing portfolios to grow and supporting further borrowing. This can create a reinforcing cycle where rising markets encourage even greater risk-taking.
S&P 500 Price Forecast
Every new S&P 500 analysis as it publishes, today's technical signal and key levels, live price — on one page.
See all S&P 500 forecastsWhy Leverage Matters
The danger is that the same mechanism that supports markets during periods of strength can accelerate declines when conditions reverse. When asset prices begin falling, leveraged investors face declining portfolio values and increasing pressure to reduce exposure. Brokers may issue margin calls, forcing investors to either provide additional capital or liquidate positions. These forced sales can intensify downward momentum, creating a cycle where falling prices trigger more selling and further declines.
This process can rapidly transform an ordinary market correction into a much deeper downturn. Historically, leverage-driven liquidation has played a central role in several of the largest equity sell-offs of the past three decades.
Previous Market Cycles
The Dot Com Bubble
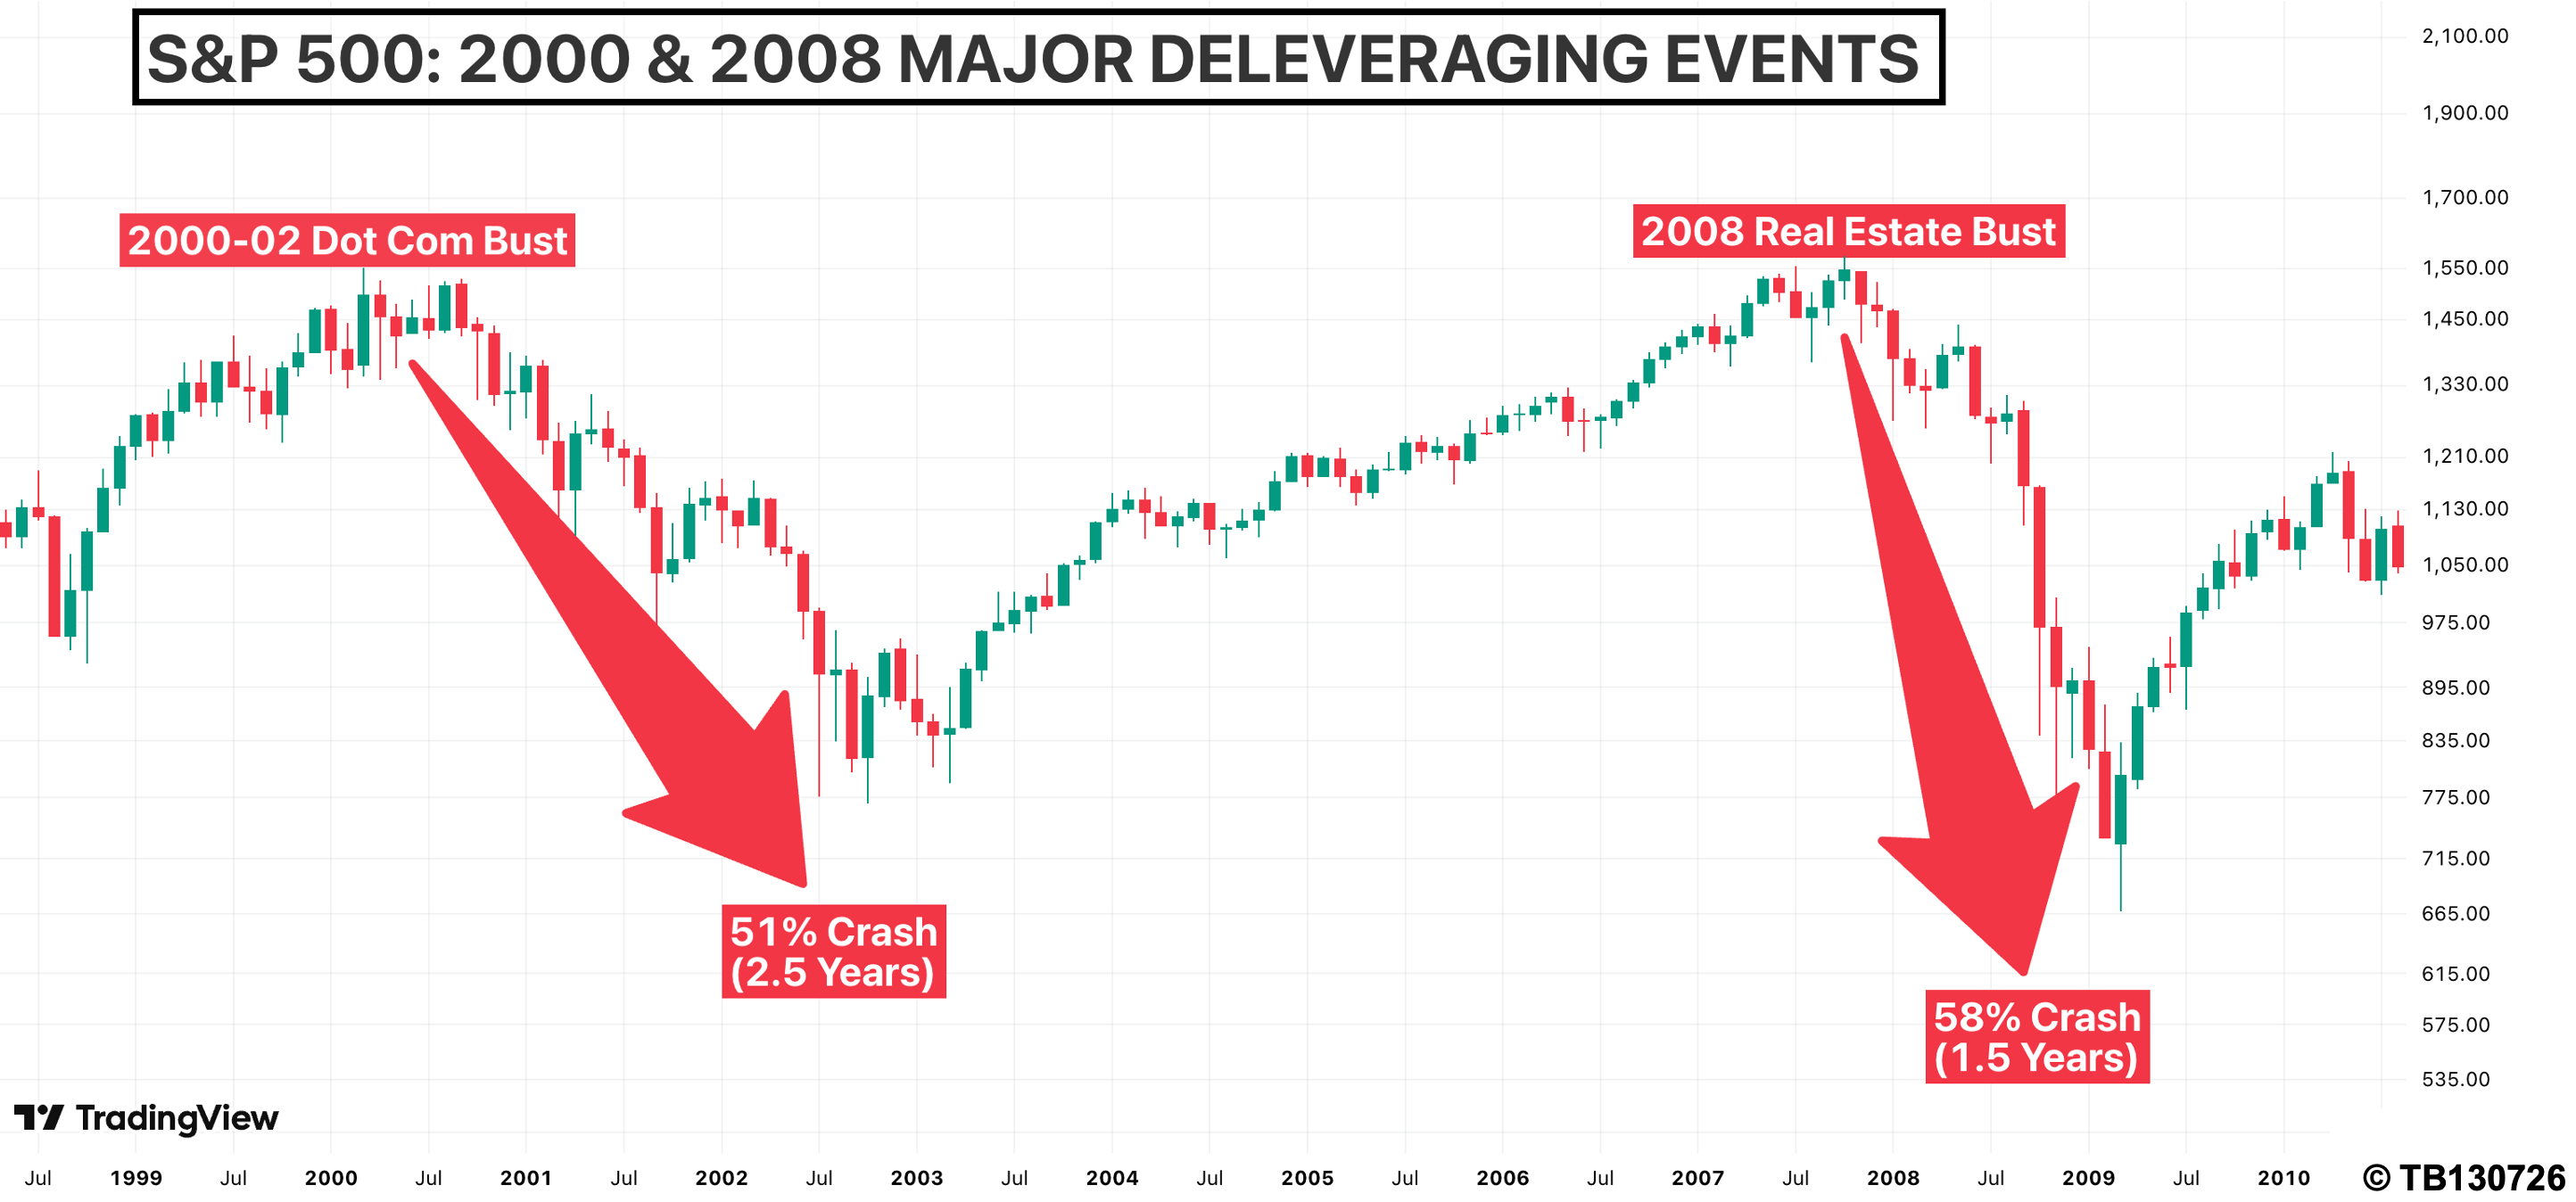
During the technology bubble of 2000, investor enthusiasm surrounding internet companies pushed valuations to unprecedented levels. At the height of the cycle, investor credit bottomed at -$132 billion. Although that figure appeared extreme at the time, the subsequent unwind proved devastating. The S&P 500 ultimately declined 51% over the following two years. As leveraged positions were unwound, investor credit reversed sharply, eventually swinging to +$45 billion by 2002. That deleveraging process laid the groundwork for a healthier market structure, helping support the subsequent 100% rally in the S&P 500 between 2002 and 2007.
The Housing Bubble
A similar pattern emerged during the Global Financial Crisis. Before the market peaked in 2007, investor credit had fallen to -$61 billion. While leverage levels were considerably lower than those seen during the Dot Com era, the eventual outcome proved even more severe. The S&P 500 plunged 58% as the housing market collapsed and financial institutions faced mounting losses. Investor credit subsequently rebounded dramatically, reaching +$153 billion by 2008, signalling a broad reset in market leverage. That cleansing process eventually preceded one of the strongest bull markets in history, with the S&P 500 rallying approximately 1,000% from 2009 to the present.
Across both cycles, the sequence followed a familiar pattern:
- Elevated leverage helped inflate asset prices.
- Deleveraging accelerated the downturn.
- A reset in investor positioning established the conditions for the next long-term expansion.
Today’s Numbers Stand Apart
Making historical comparisons offers a frightening perspective regarding where we sit today, Current investor credit figures have reached a mind blowing $992 billion. That is:
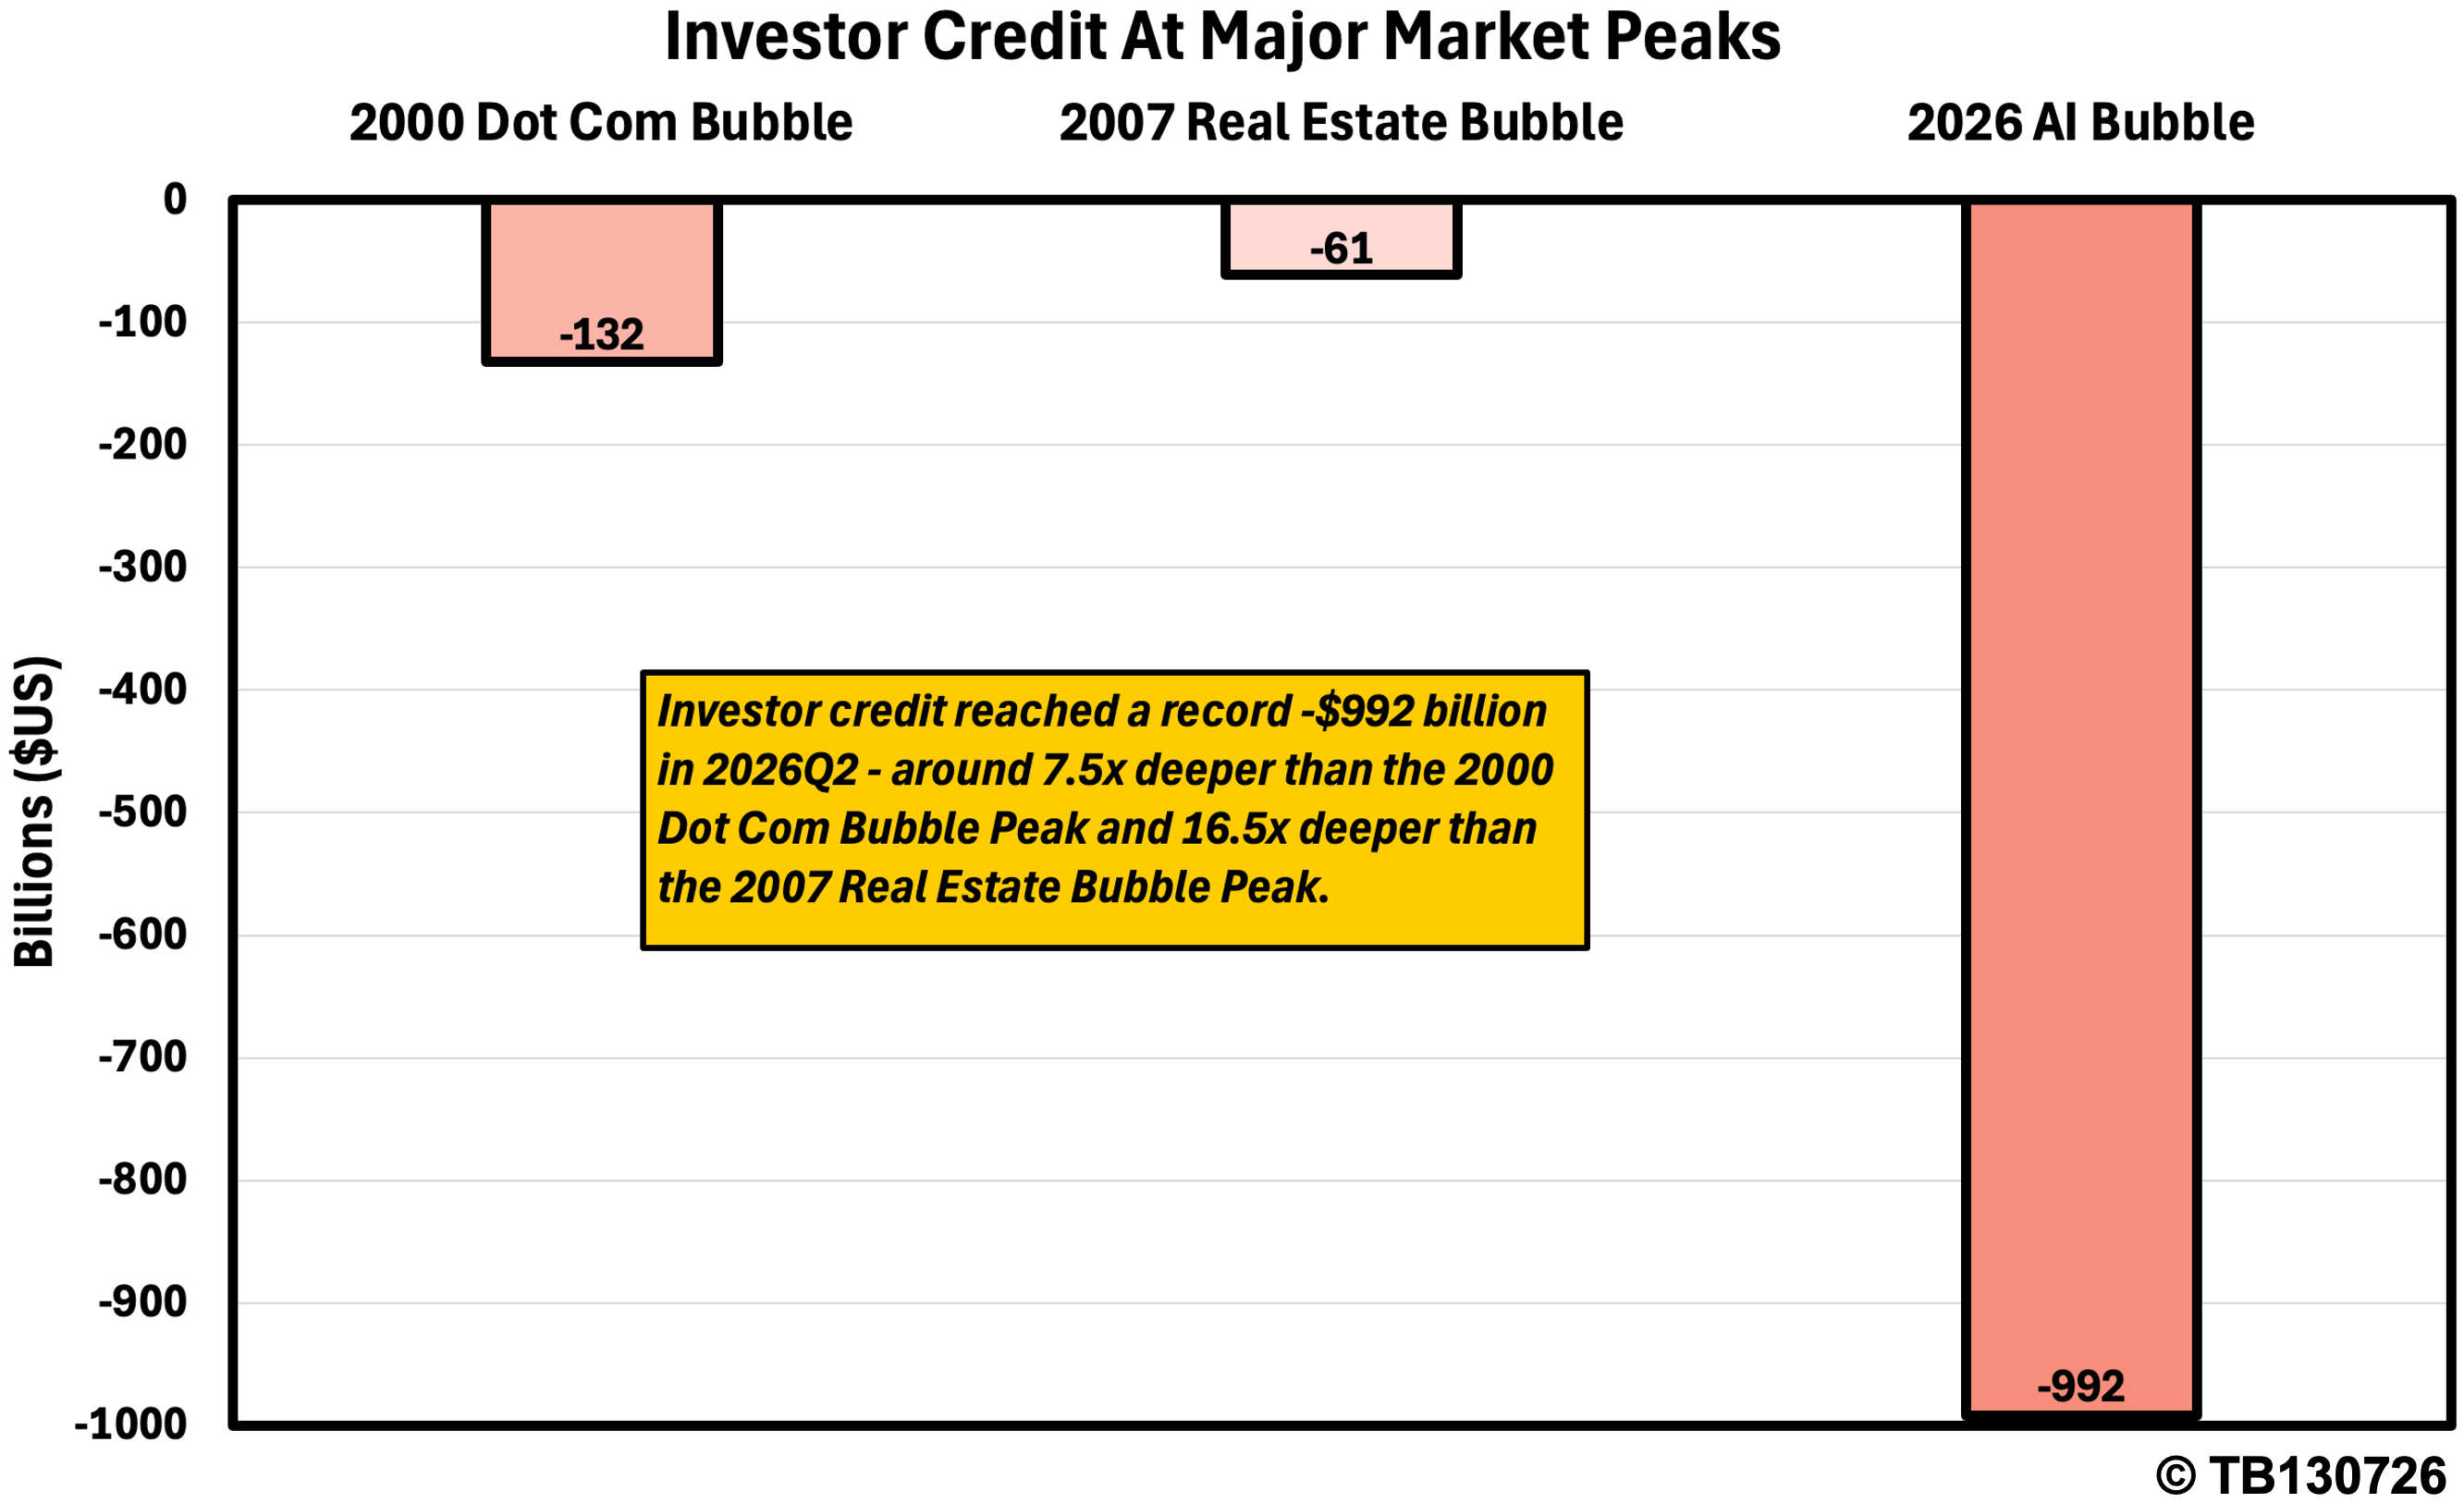
- 7.5 times worse than the 2000 Dot Com Bubble.
- 16.5 times deeper than the 2007 Real Estate Bubble.
Are you comfortable with how much margin borrowing has expanded during the current market cycle?
Does Record Leverage Mean A Crash Is Imminent?
It is important to distinguish between elevated leverage and an imminent market collapse. High levels of investor borrowing do not automatically trigger a downturn. Markets can remain heavily leveraged for extended periods, particularly when corporate earnings continue growing, economic conditions remain supportive, and investor confidence stays elevated. Nevertheless, leverage significantly increases market vulnerability if selling pressure emerges.
How Severe Could The Fallout Be?
One of the more striking observations from previous cycles concerns the relationship between leverage and market declines. The S&P 500 fell 51% following investor credit of -$132 billion. It declined 58% after investor credit reached -$61 billion. Today, investor credit stands, as already mentioned, at $992 billion.
If previous bear markets swept in when leverage represented only 13% and 6% of today’s levels, investors may reasonably ask whether current downside risks could exceed those experienced during either the Dot-Com collapse or the Global Financial Crisis.
Of course, financial markets rarely accord with simple mathematical relationships. Higher leverage does not necessarily imply proportionally larger declines. Economic conditions, corporate earnings, central bank policy and fiscal responses all influence eventual outcomes.
Even so, today’s debt exposure highlights the extent to which market stability increasingly depends on continued investor confidence. Should confidence weaken materially, the adjustment process could become considerably more volatile.
Expressing The View
For investors who believe the AI-driven equity boom may eventually unwind into a significant bear market, the challenge is not simply identifying the risk, but determining how to express that view while managing the possibility that markets continue to rise.
An approach I would use is to examine the behaviour of the S&P 500 following major breakout levels. Since breaking above the previous 2000 and 2007 highs around the 1,550-1,575 point tally in 2013, the S&P 500 has followed a remarkably consistent pattern: Once the index breaks above a major pivot high and reaches new all-time highs, it has never subsequently closed below that prior pivot high.
Since 2013, five major pivot highs have defined the market structure:
- The May 2015 pivot high at 2,135 points
- The February 2020 pivot high at 3,394 points
- The January 2022 pivot high at 4,819 points
- The February 2025 pivot high at 6,147 points
- The January 2026 pivot high at 7,002 points
Each time the S&P 500 broke above these levels and entered new all-time-high territory, those previous highs became structural support.
- The index never closed below 2,135 points after breaking above the May 2015 high, even during the Covid crash when it reached 2,192 points.
- It never closed below 3,394 points after breaking above the February 2020 high, even during the 2022 bear market when it reached 3,492 points.
- It never closed below 4,819 points after breaking above the January 2022 high, even during the 2025 tariff sell-off when it reached 4,835 points.
- Finally, it never closed below 6,147 points after breaking above the February 2025 high, even during the 2026 geopolitical-driven sell-off when it reached 6,317 points.
Using this framework, the January 2026 pivot high of 7,002 points becomes the critical line in the sand. As long as the S&P 500 remains above 7,002, the bullish structure that began in 2013 remains intact. A confirmed break below this level would represent a significant technical deterioration and potentially signal the end of the 2009-present secular bull market.
A Potential Bearish Strategy
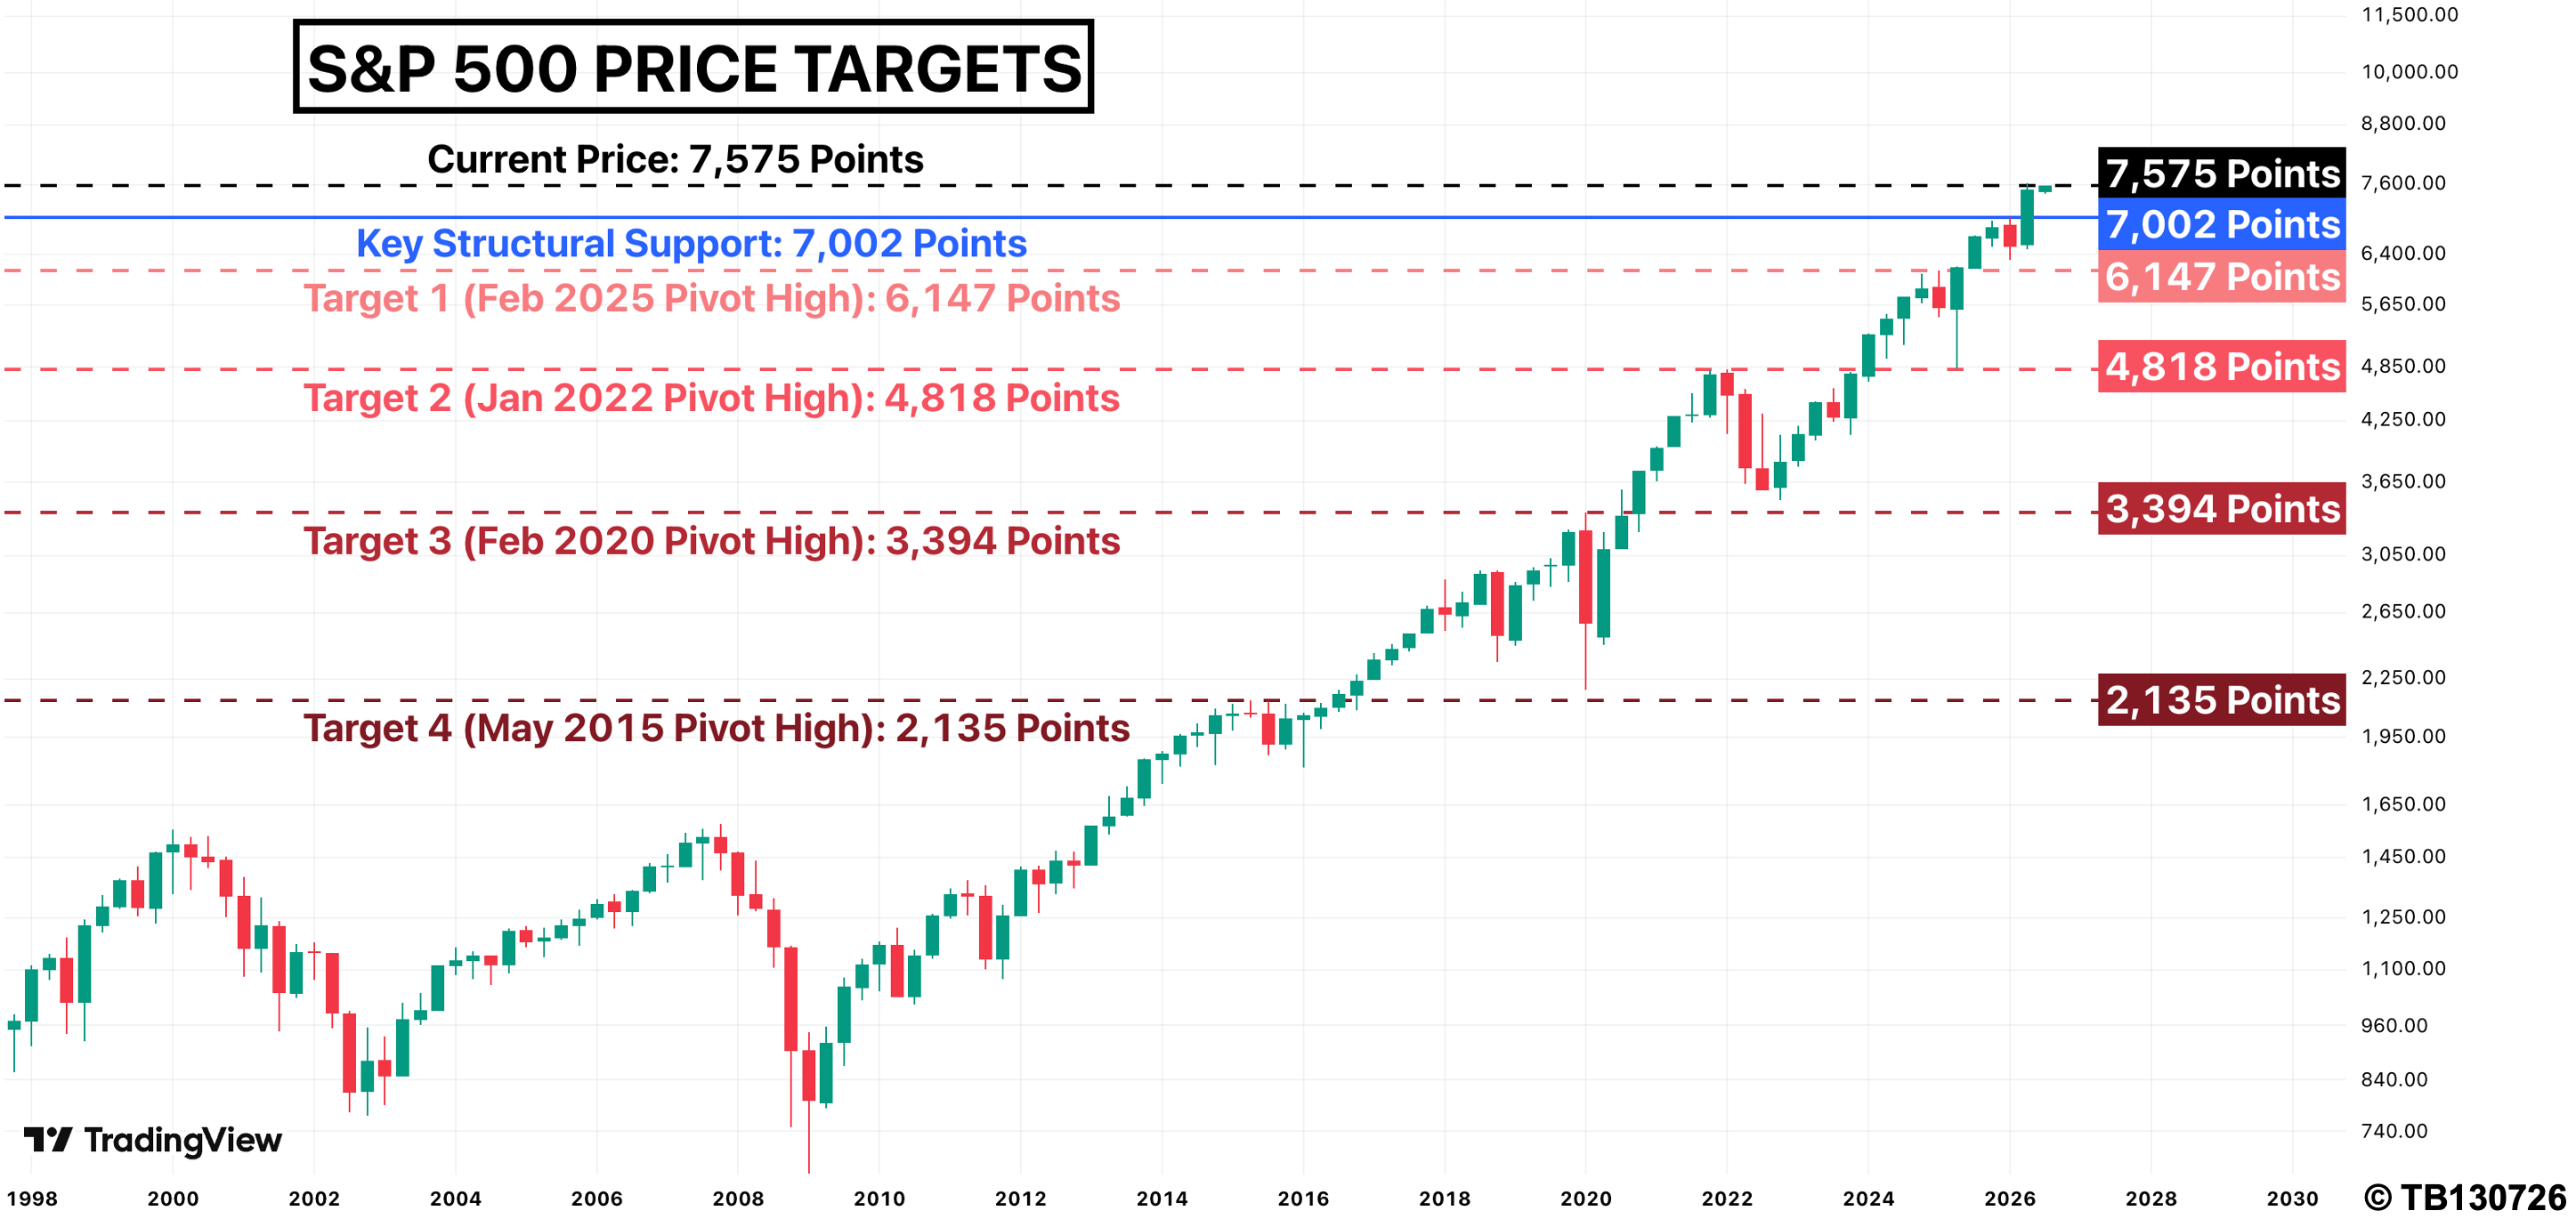
A risk-managed approach I would use would be to remain long the S&P 500 while it trades above 7,002 points. If the index breaks below this level, the long position would be exited and a short position would be initiated with the objective of targeting previous major pivot highs.
- The first target would be 6,147 points, the February 2025 pivot high, representing a 19% decline from current levels.
- The second target would be 4,819 points, the January 2022 pivot high, representing a 37% decline from current levels.
- The third target would be 3,394 points, the February 2020 pivot high, representing a 55% decline from current levels.
- The final target would be 2,135 points, the May 2015 pivot high, representing a 72% decline from current levels.
A disciplined approach I would use would involve reducing exposure progressively as these levels are reached:
- Covering 25% of the short position at 6,147 points.
- Covering 33% of the remaining position at 4,819 points.
- Covering 50% of the remaining position at 3,394 points.
- Exiting the final position at 2,135 points.
The Bottom Line
The AI revolution continues to reshape financial markets, propelling a heady and intoxicating enthusiasm across U.S. equities. Whether that optimism ultimately proves justified will depend on technological progress, corporate profitability and broader economic conditions. However, investor credit offers a different perspective. Rather than measuring innovation or earnings, it measures risk appetite. And at -$992 billion, that risk appetite has reached levels never previously recorded.
Investor credit may not predict exactly when markets will turn. But the S&P 500’s long-term trend structure provides investors with a framework for identifying when the market regime has changed.
The question investors should now consider is straightforward: How long can the largest leverage build-up in modern market history continue before the debt finally demands repayment?