



Bitcoin (BTC-USD) topped out last October, then spent the next four months as a falling knife. 2026 hasn’t been much better: January closed down 10%, February shed another 15%, and by the time the dust settled near $60,000, BTC finally hit oversold. It clawed its way back through the $70,000 psychological line and just punched through immediate resistance and the 50-EMA. BTC is trading around $74,700 now and clearly has its sights set on the $85,000 range highs. That is the same level that acted as the floor back in late January before the bottom fell out.
The 200-EMA is sitting at roughly $86,500, and until BTC can close above that line with conviction, we can’t be confident about the breakout. The tape doesn’t lie. Every failed rebound of the last six months has died somewhere between the February lows and the 200-EMA. The question for investors right now isn’t whether Bitcoin can tag $75,000 or even $80,000. It’s whether there’s enough fuel left in the tank to challenge the one level that actually matters: if the 200-EMA holds, its downtrend will keep the price under $85,000 for the foreseeable future.
The Liquidity Tide Turned For Bitcoin
Bitcoin’s February bottom didn’t happen in a vacuum, and neither did the rebound. To understand why BTC is breaking out right now—and why the ceiling above it matters more than the floor below—you have to look at what was happening in credit markets. Liquidity does a lot of the heavy lifting for Bitcoin, and tightening conditions gave BTC the squeeze.
Financial conditions tightened hard into the February lows. Credit spreads were backing up, and risk assets were bleeding. High-yield spreads have tightened meaningfully over the last several weeks. The high-yield bond spread is sitting near 2.94%, back in the neighborhood of 2025 levels.
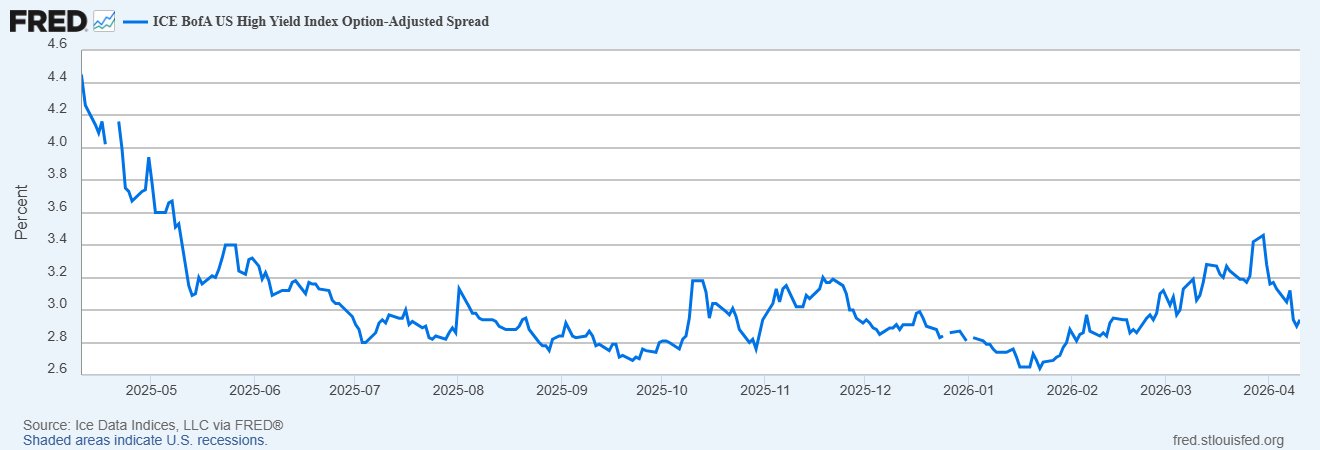
Investment grade has followed the same script. That’s not a small move. When credit spreads compress this quickly, it tells you that risk appetite is rebuilding and that the marginal dollar is flowing back into the riskier corners of the capital stack, like Bitcoin. A divided Fed leaning dovish doesn’t hurt either; the doves are pushing for more cuts despite the sticky inflation data, and the market is front-running that shift.
Bitcoin, as usual, is just the sharpest expression of whatever the liquidity tape is already saying; it acts as a call option on risk appetite—one of the reasons I think Bitcoin is often compared to tech-heavy stock indexes like the Nasdaq 100.
When spreads tightened, BTC caught a bid. Short positioning unwound, and BTC squeezed higher. A $427 million short squeeze kicked off the current leg and reminded us how violently positioning can reverse when the underlying conditions shift. Bitcoin isn’t trading like digital gold; it’s trading like a high-beta liquidity proxy. That has been triggering significant covering among shorts, driving Bitcoin up into its current breakout.
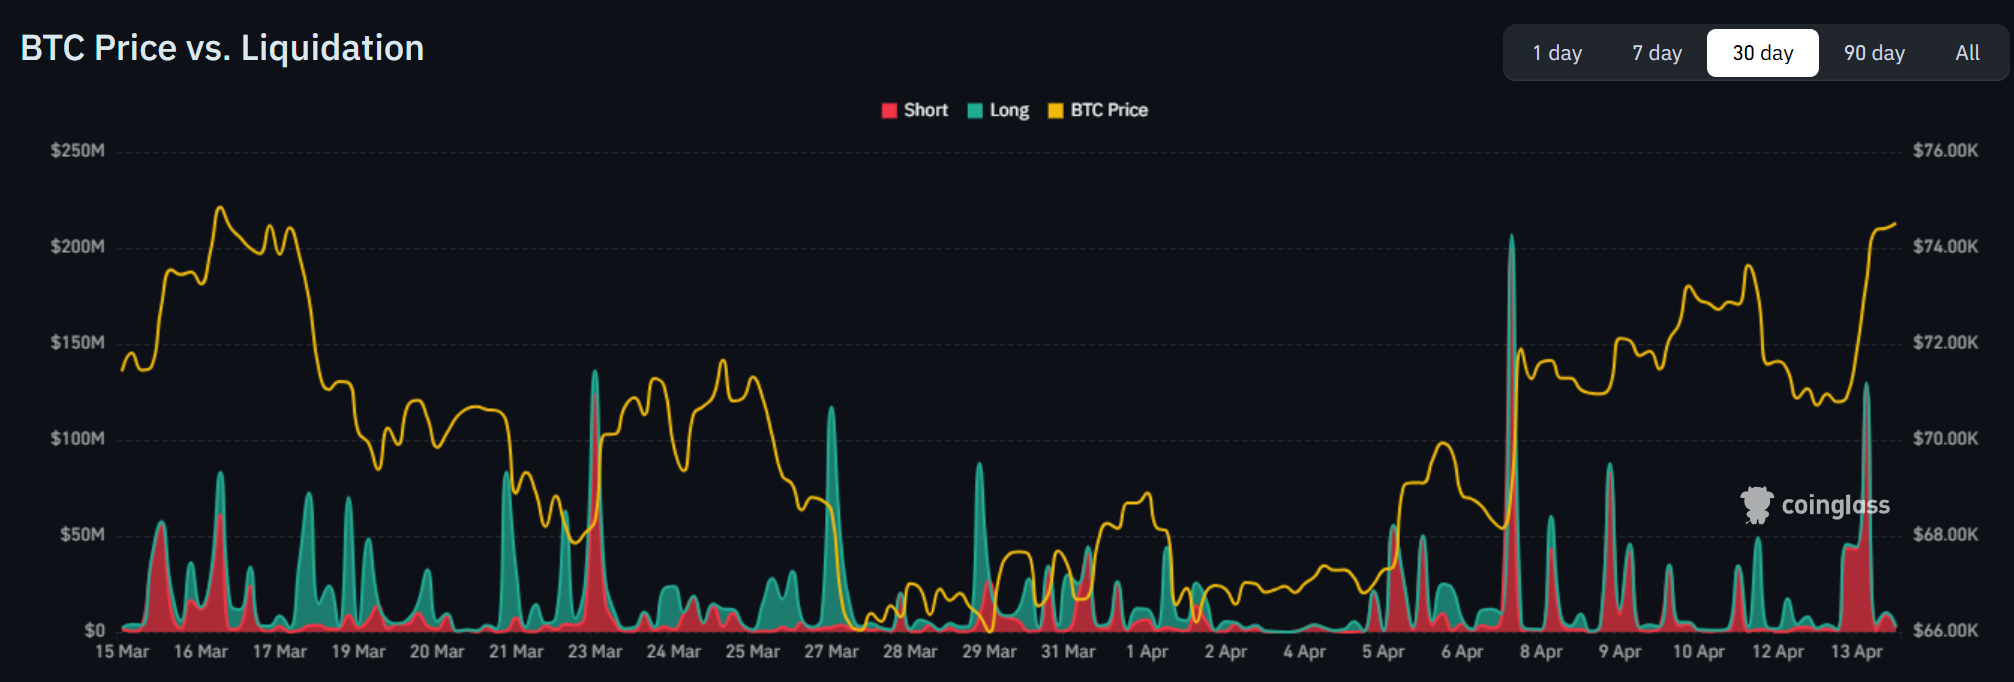
Here’s the catch: the easy part of this move is probably behind us. Spreads don’t have much more room to compress from here. The macro tailwinds that carried BTC off the February lows are starting to look more like a setup for a fade than a platform for a secondary breakout of the trend. Bulls still have a lot to prove.
Bitcoin Price Forecast
Every new Bitcoin analysis as it publishes, today's technical signal and key levels, live price — on one page.
See all Bitcoin forecastsBitcoin Technical Outlook
The death cross came in December, and since then, it’s been downhill. The bottom was hit in early February, where Bitcoin started to trade around the anchored VWAP, which now sits at ~68,200. April brought liquidity easing, spreads tightening, and a lift for Bitcoin. BTC now trades at ~74,500.
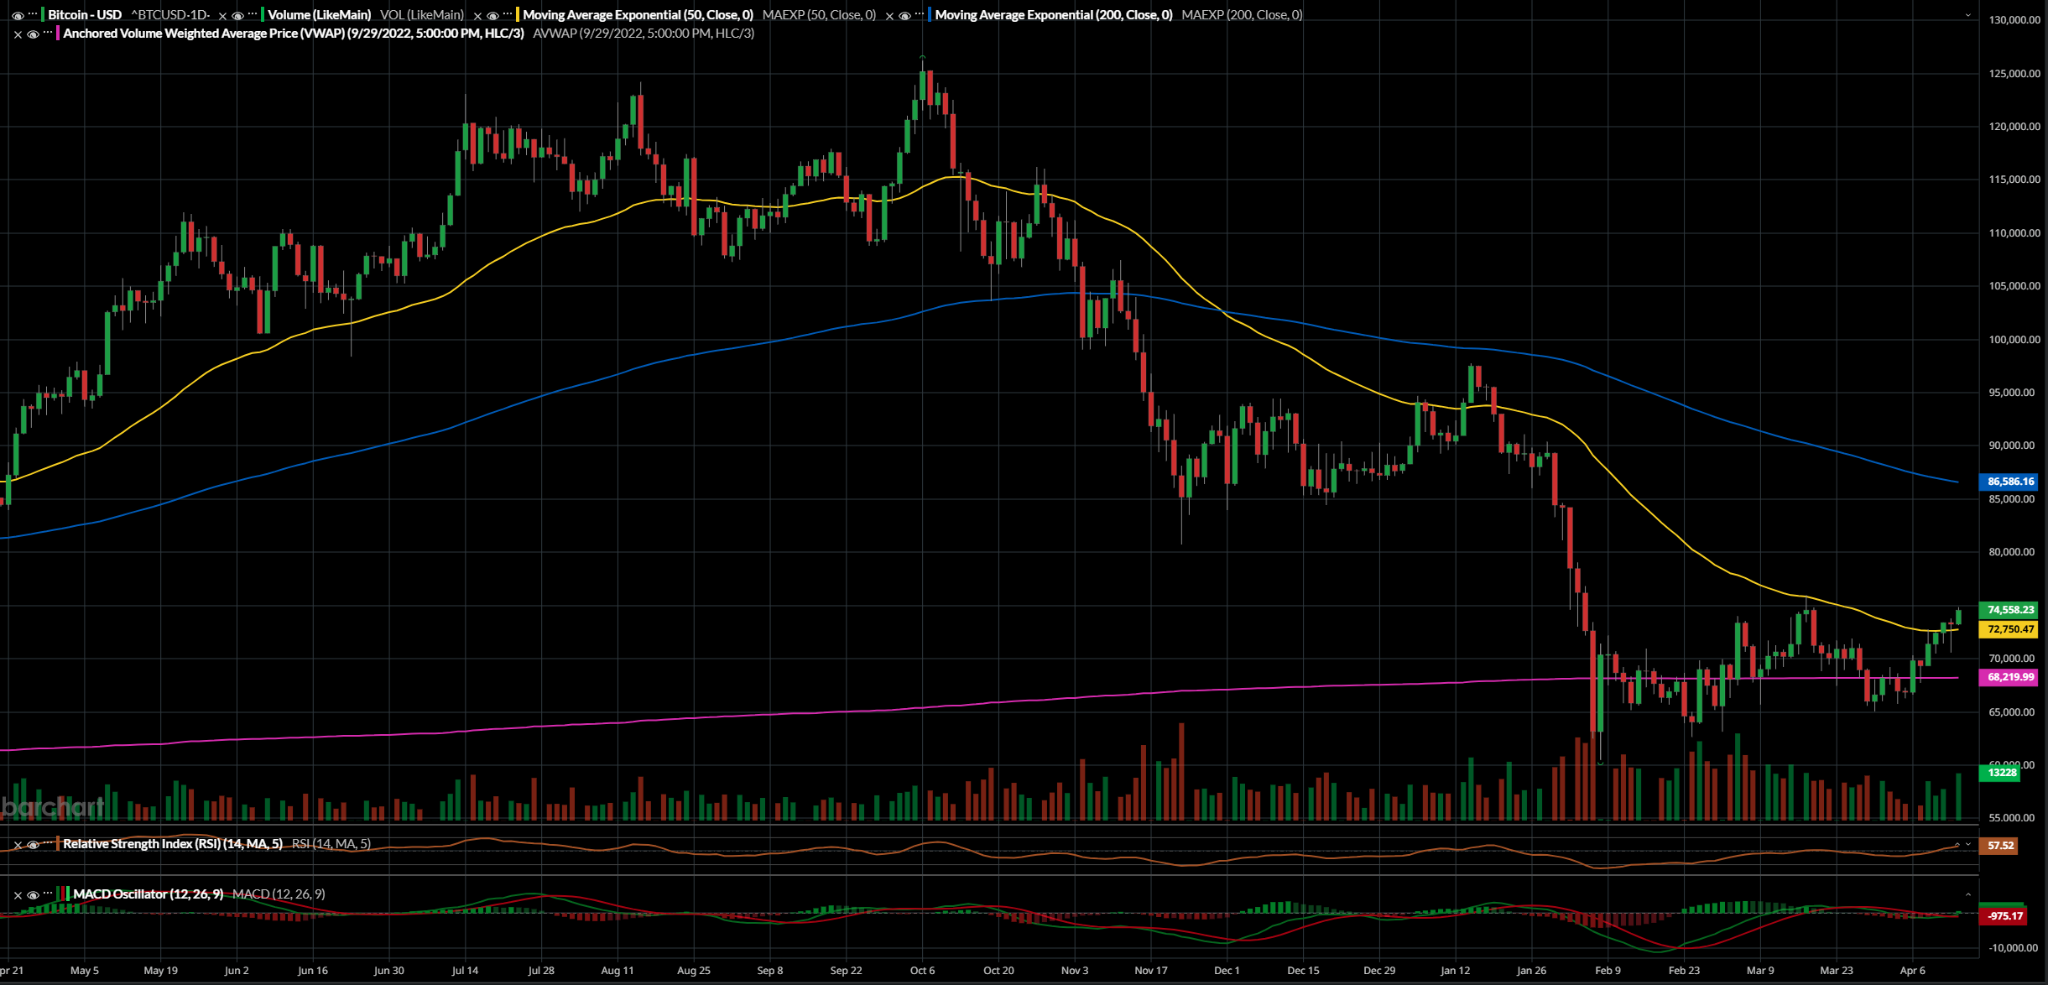
The breakout above the 50-EMA at 72,750 is promising, because that line has been acting as a ceiling for Bitcoin since October. While it has now had a full candle open and close above the line, we may still see a fade here. Bitcoin is already close to its nearest resistance zone that was previously enforced by the 50-EMA at 75,000, and will likely still be enforced by sellers. I expect it to need a retest before it continues up from here. Two firm rejections from the 75,000 level would suggest that this breakout is a bull trap, as we’ve seen with past false breakouts like in early January.
Beyond that, the real challenge remains that 200-EMA, which is trending lower and is currently at ~86,500. But it may take Bitcoin a month or more to climb that distance given its current average volume, and by then, the 200-EMA is likely to fall even further and put a ceiling on Bitcoin. It will act as firm resistance. Breaking this level will be critical to sustaining a move back toward the old highs.
If bulls can take the reins here, and it’s still unclear if they will be able to fully break out of this level, we will need to reassess the situation when Bitcoin hits the 200-EMA.
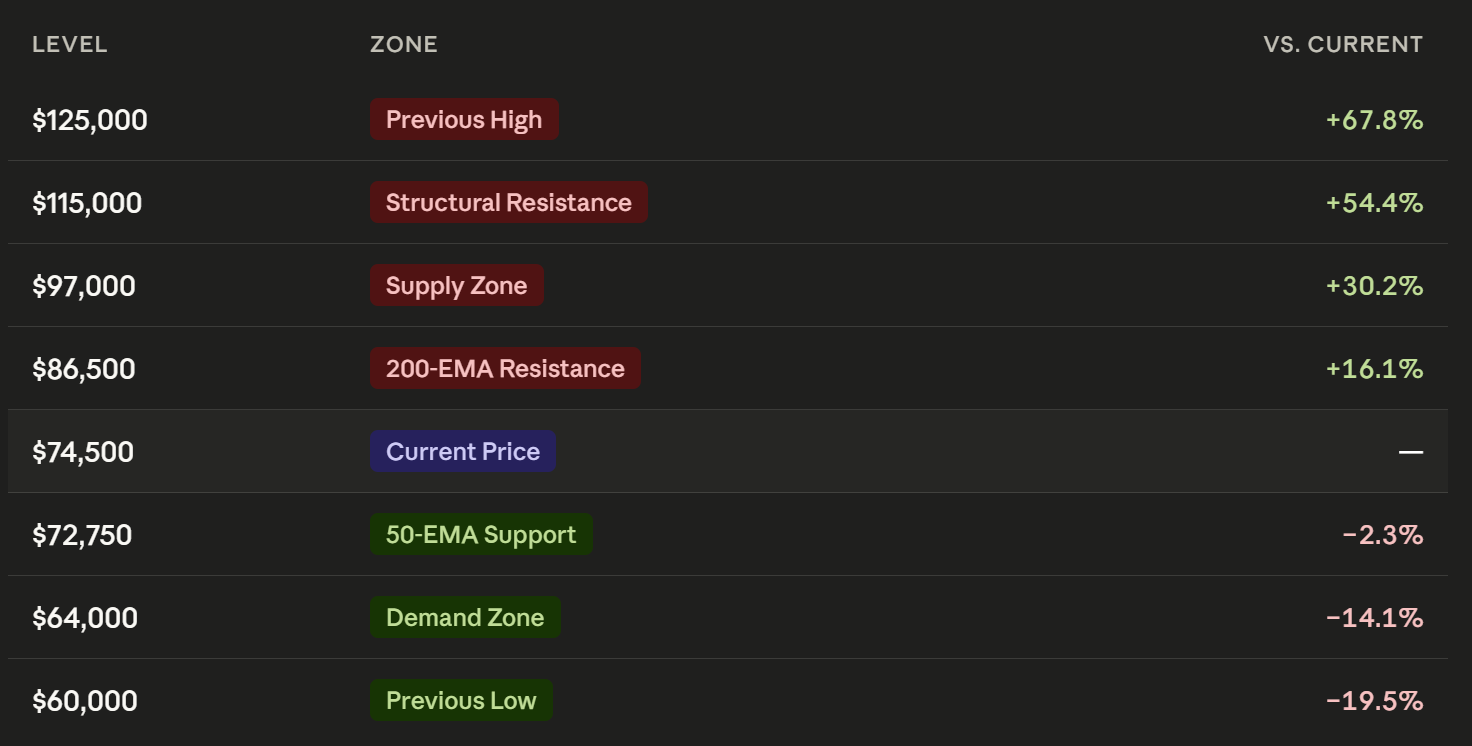
Here are the key levels to watch. I included the previous high as a reminder of just how far Bitcoin has fallen on the one-year chart.
Conclusion
The easy part is over, and the 50-EMA has been reclaimed. Bitcoin bottomed, squeezed the shorts, and rode a credit-driven liquidity tailwind back to the upper end of its recent range.
Upside to the next meaningful ceiling at $86,500 is roughly 16%. The downside to the February demand zone near $64,000 is roughly 14%. That’s solid on paper, but technicals don’t move in isolation and the tailwinds that got BTC here are mostly spent. Spreads have already tightened, short positioning has been cleaned out, and the bulls will need to put up and prove this breakout is real to get any more movement from here.
My read: play this as a tactical long with tight risk, not a conviction bet. A push into the $75,000 zone is the signal (not just a tag, but a real push up past it); anything above that on volume opens the door to a run at $86,500. But the 200-EMA is where Bitcoin often hits its ceiling, and until BTC proves it can close above that line with conviction, every rally is still suspicious.
Bears have it easy here: this could all be a bull trap. Lose the 50-EMA at $72,750 and this whole setup flips back to defense, with the February lows in play faster than most bulls are prepared for. We could hit as low as $64,000 before structural demand sets in. That’s a long way to go, especially for investors with six-figure buy-in prices. Risk management is prudent here, and investors should consider keeping their exposure tight.