



Copper (XCU) prices remain strong despite inflation concerns, high U.S. Treasury yields and a stronger U.S. dollar. In my view, the copper market remains in a strong bullish trend but it requires the price to close above $6 in Q2 2026. This article discusses the macro drivers, signals from China, supply disruptions, and demand for AI. The article also discusses the long-term price patterns and short-term breakout zones to understand the next move in copper prices.
Macro Pressure Tests Copper’s Bullish Setup
Higher Yields and a Stronger Dollar Limit Copper’s Rally
The copper market is finding itself in a sweet spot between the solid demand for the long term and the tight financial conditions. The uncertainty over inflation has put bond markets around the world in a more volatile period. U.S. Treasury yields have risen to multi-decade highs. It is important for copper because increased yields tend to strengthen the U.S. dollar and diminish the demand for risk assets.
Despite the surge in Treasury yields, the copper prices remain strong due to the supply picture. I believe there is a tug of war between macro and micro forces at play with copper. The micro story continues to be supportive with limited availability and increasing demand from power grids, electrification and AI data centers. But the macro picture remains less friendly. The higher inflation expectations, elevated Treasury yields and a stronger dollar have limited the copper rallies. If macro forces become supportive, the copper prices will explode higher with greater momentum.
There’s another uncertainty in China. Chinese government bonds remain near historic lows which reflects low confidence in domestic manufacturing and property activity. This is important as China is still a leading consumer of copper. If the Chinese industrial sector does not recover, copper could struggle to move higher. Bond markets are currently very choppy. The signs of stronger demand from China will likely be required to keep strong prices.
Supply Disruptions and Tariff Stockpiling Support Copper Demand
The demand side for copper is robust. The long-term copper picture remains solid despite a weak supply. There have been a number of significant disturbances that have lowered expectations for future availability. Grasberg in Indonesia will be available for full production in 2028, following a fatal mud slide in 2025.
Copper Price Forecast
Every new Copper analysis as it publishes, today's technical signal and key levels, live price — on one page.
See all Copper forecastsLast year, there was also flooding at the Kamoa-Kakula mine in the Democratic Republic of Congo and an accident at El Teniente in Chile that impacted supply. These disruptions are important because copper demand is shifting towards more structural demand while new mines are taking a long time to come online.
Inventories are also being skewed by tariff expectations. The U.S. government is considering a phased tariff on refined copper. These tariffs would begin at 15% in 2027 and increase to 30% in 2028. Traders have responded with building stockpiles in anticipation of potential duty. CME copper stocks have jumped to 577,385 tons and another 222,000 tons are in registered and off-warrant stocks at U.S. ports.
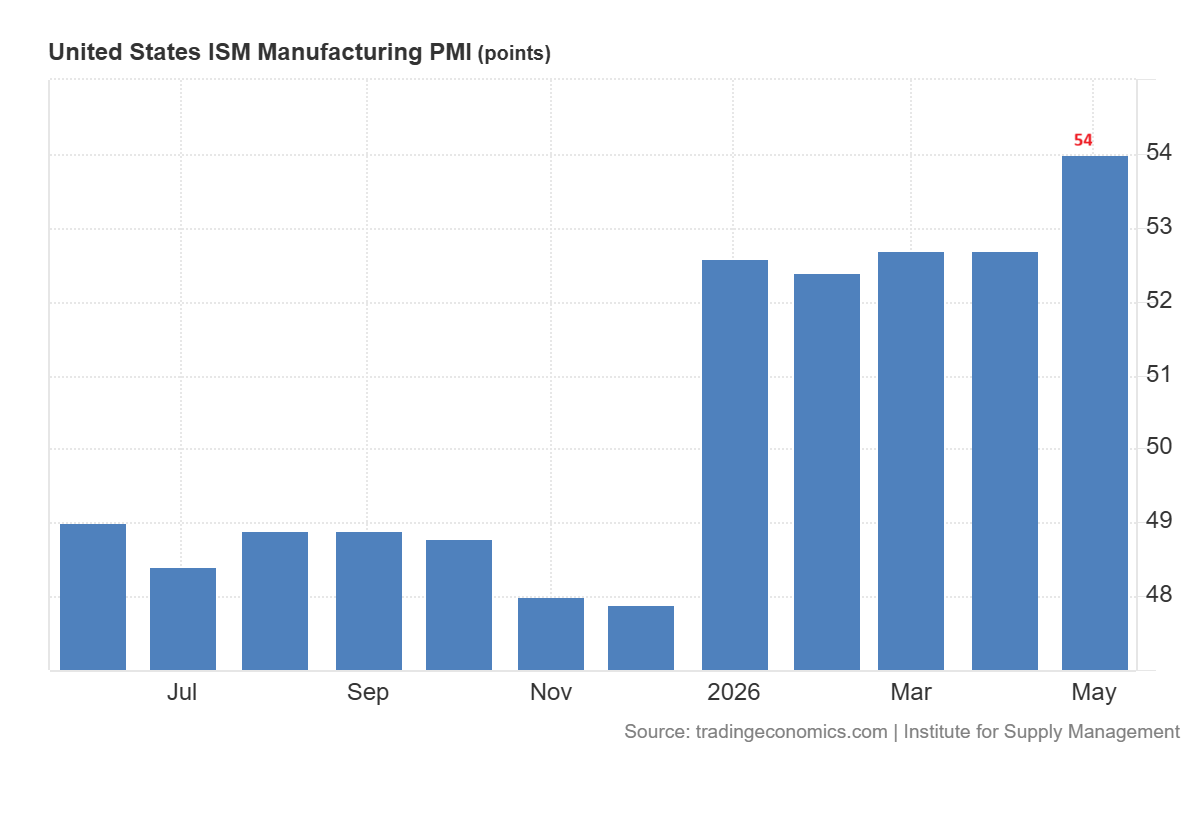
The chart below shows that the ISM Manufacturing PMI increased to 54% in May. This increase suggests expansion.
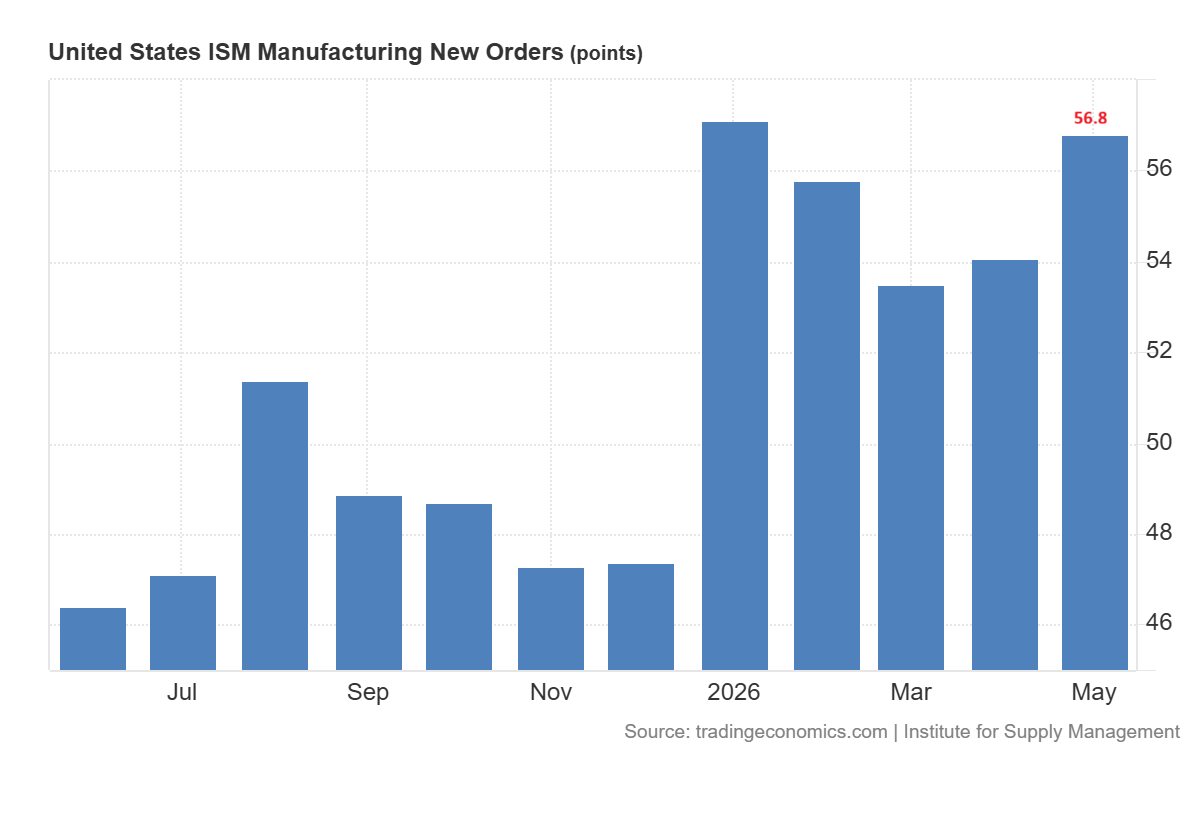
The manufacturing new orders also increased to 56.8.
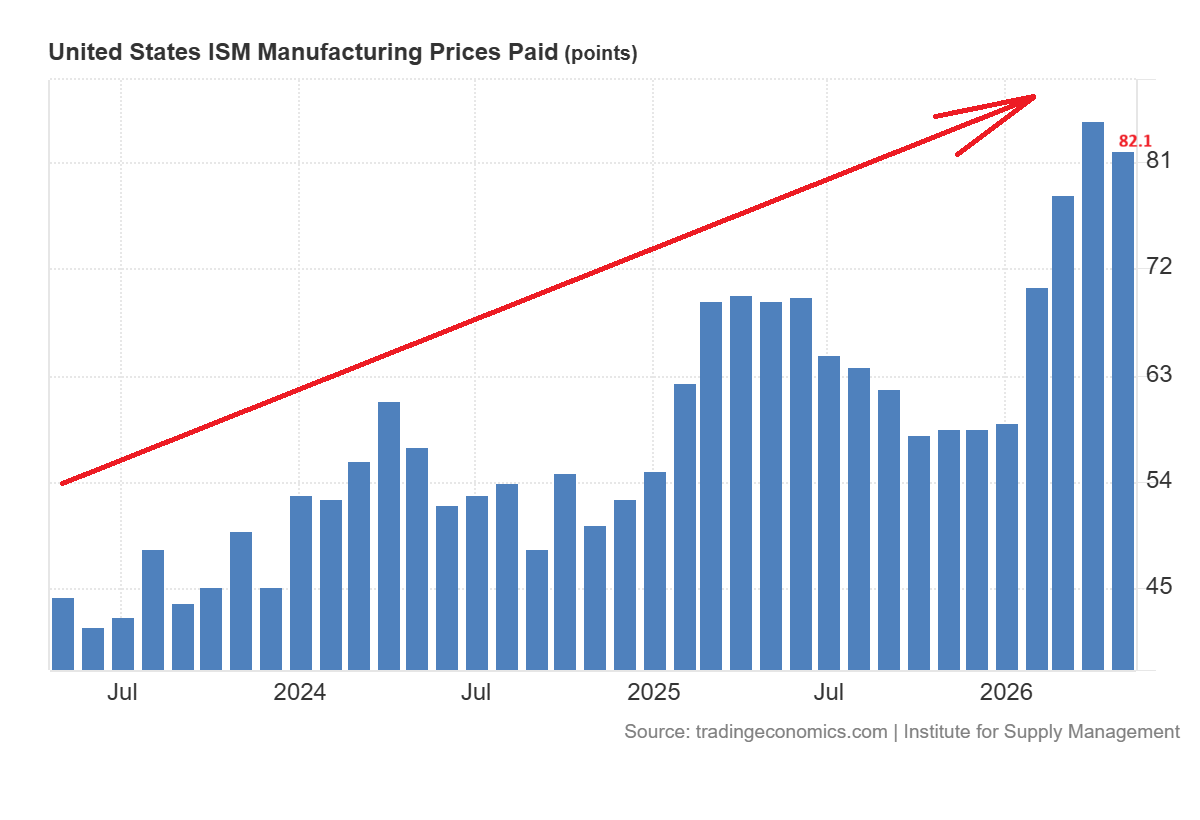
But jobs continue to decline. The ISM prices index increased to 82.1 which indicates high inflationary pressures on steel, aluminum and petroleum-based products related to Middle East tensions.
Overall copper remains a strong structural story. The larger bullish side of the equation is supported by grid expansion, electrification, AI data centers and supply issues. But the next leg up requires less bond-market stress and greater clarity of demand from China.
Copper Long-Term Outlook: Breakout Tests Key Quarterly Resistance
The long-term outlook for the copper price remains very constructive, as seen in the quarterly chart below. The copper price has been trading within the ascending channel pattern since July 2002. Each time the price hits the support line of the ascending channel, the copper price rebounds higher with a strong leap.
The bottom formations in 2008, 2016, and 2020 produced bottoms on the same line. These bottoms triggered strong rallies in copper prices.
Now, after the bottom in 2020, the price is trading within the second ascending channel pattern. This ascending channel pattern hit resistance at $6.60 in Q2 2026. The same level was hit in Q1 2026, but the price failed to close above the ascending channel resistance line at $5.96.
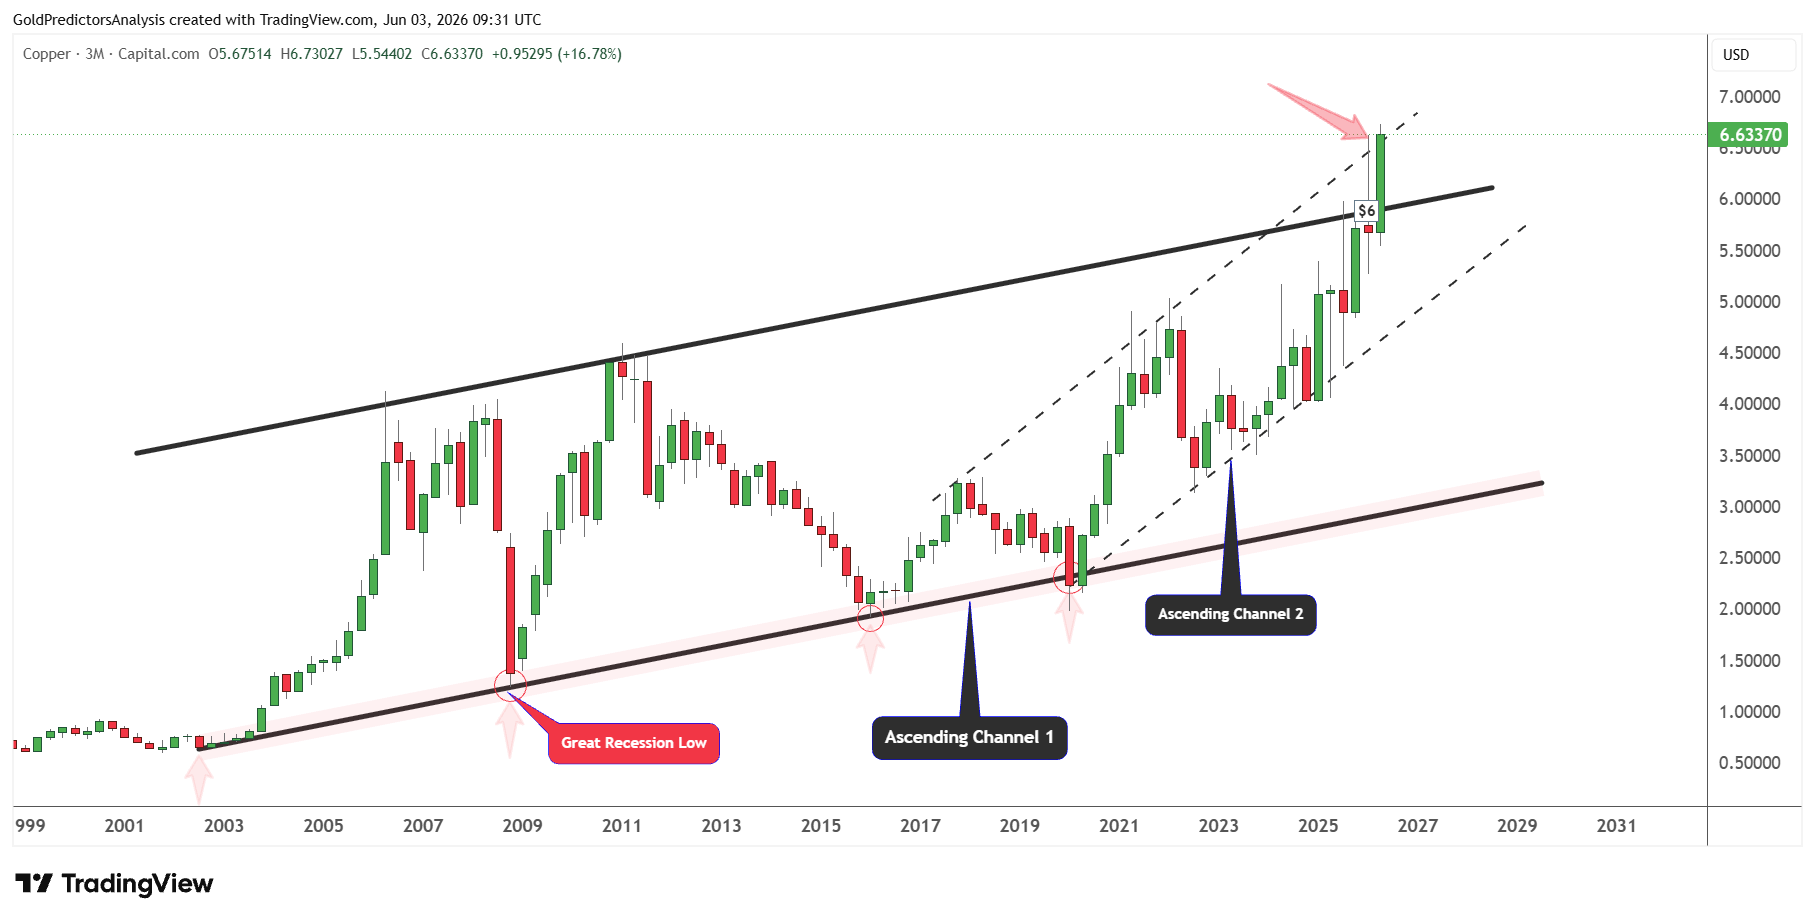
Now, this is a real test for the copper price, whether it will close above this ascending channel line at $6 in Q2 or close below this line and trigger another correction. Therefore, the June close will be important for copper.
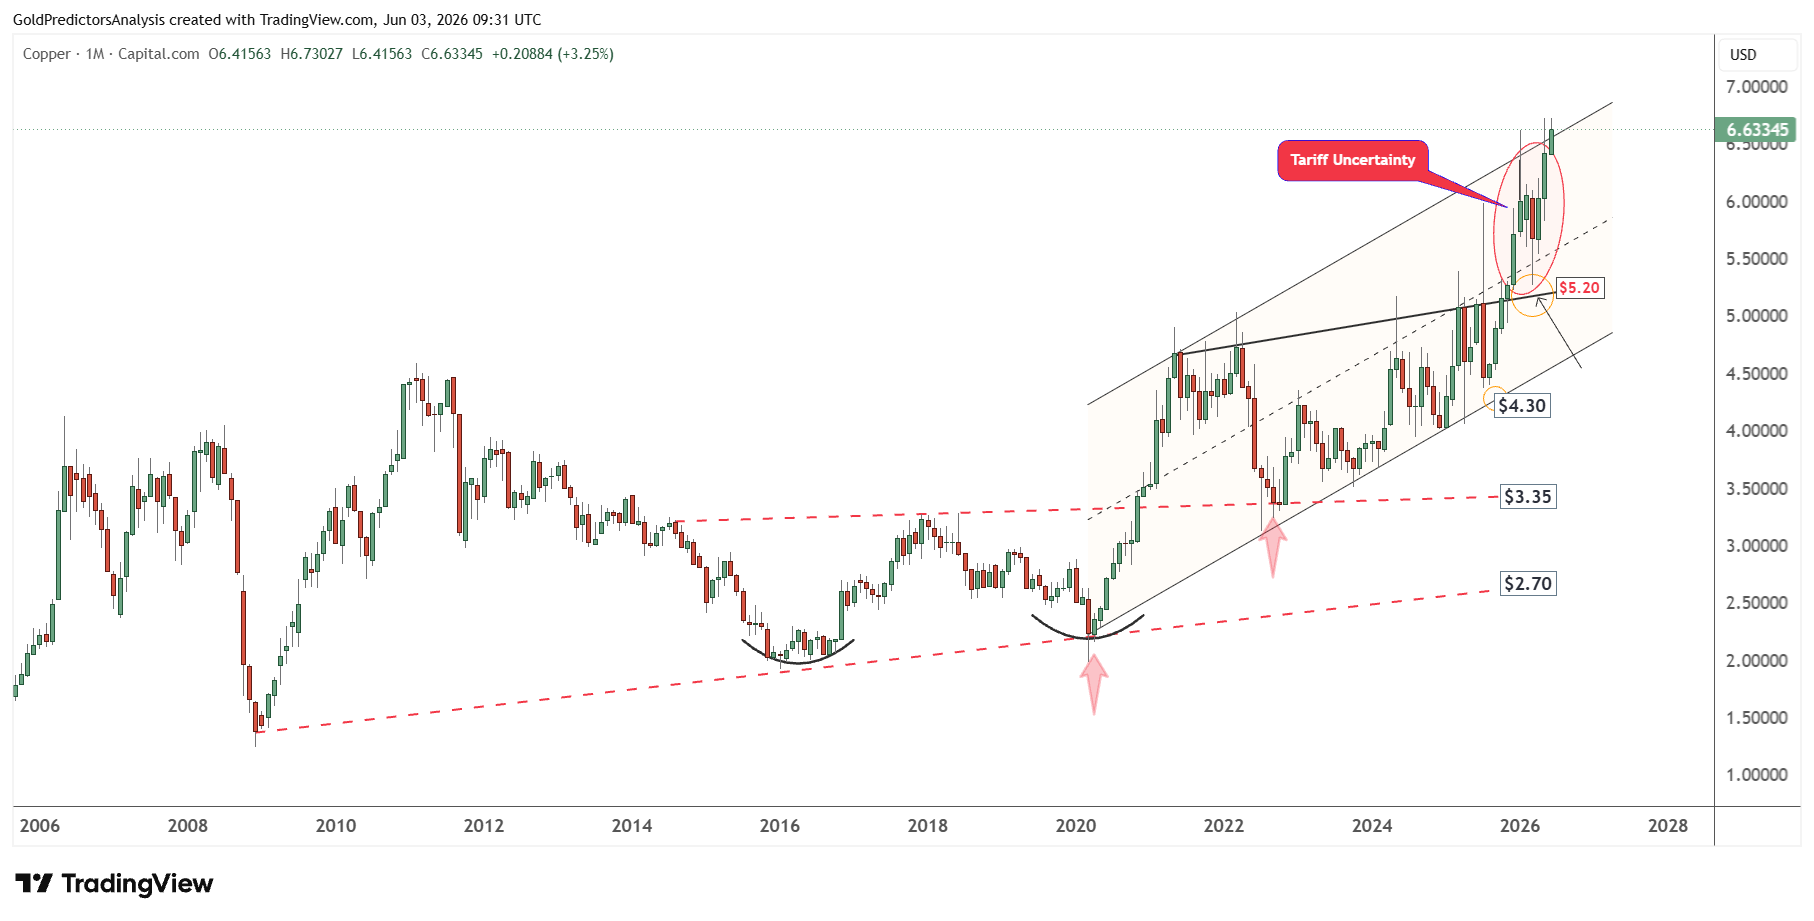
The ascending channel pattern is also observed on the monthly chart, which shows a bottom in March 2020. The prices have been consolidating within the ascending channel during the past six years.
Now, the copper price has formed strong support at the black trend line at $5.90. The price has broken the resistance at $5.90.
The black trend line at the $5.20 level in March 2026 triggered another rally to break record highs. Despite this breakout and bullish pattern, copper prices are showing strong volatility within the $5 to $6 area. The overall direction for copper remains bullish despite this volatility.
Copper Short-Term Outlook: Bullish Pattern Points to Higher Prices
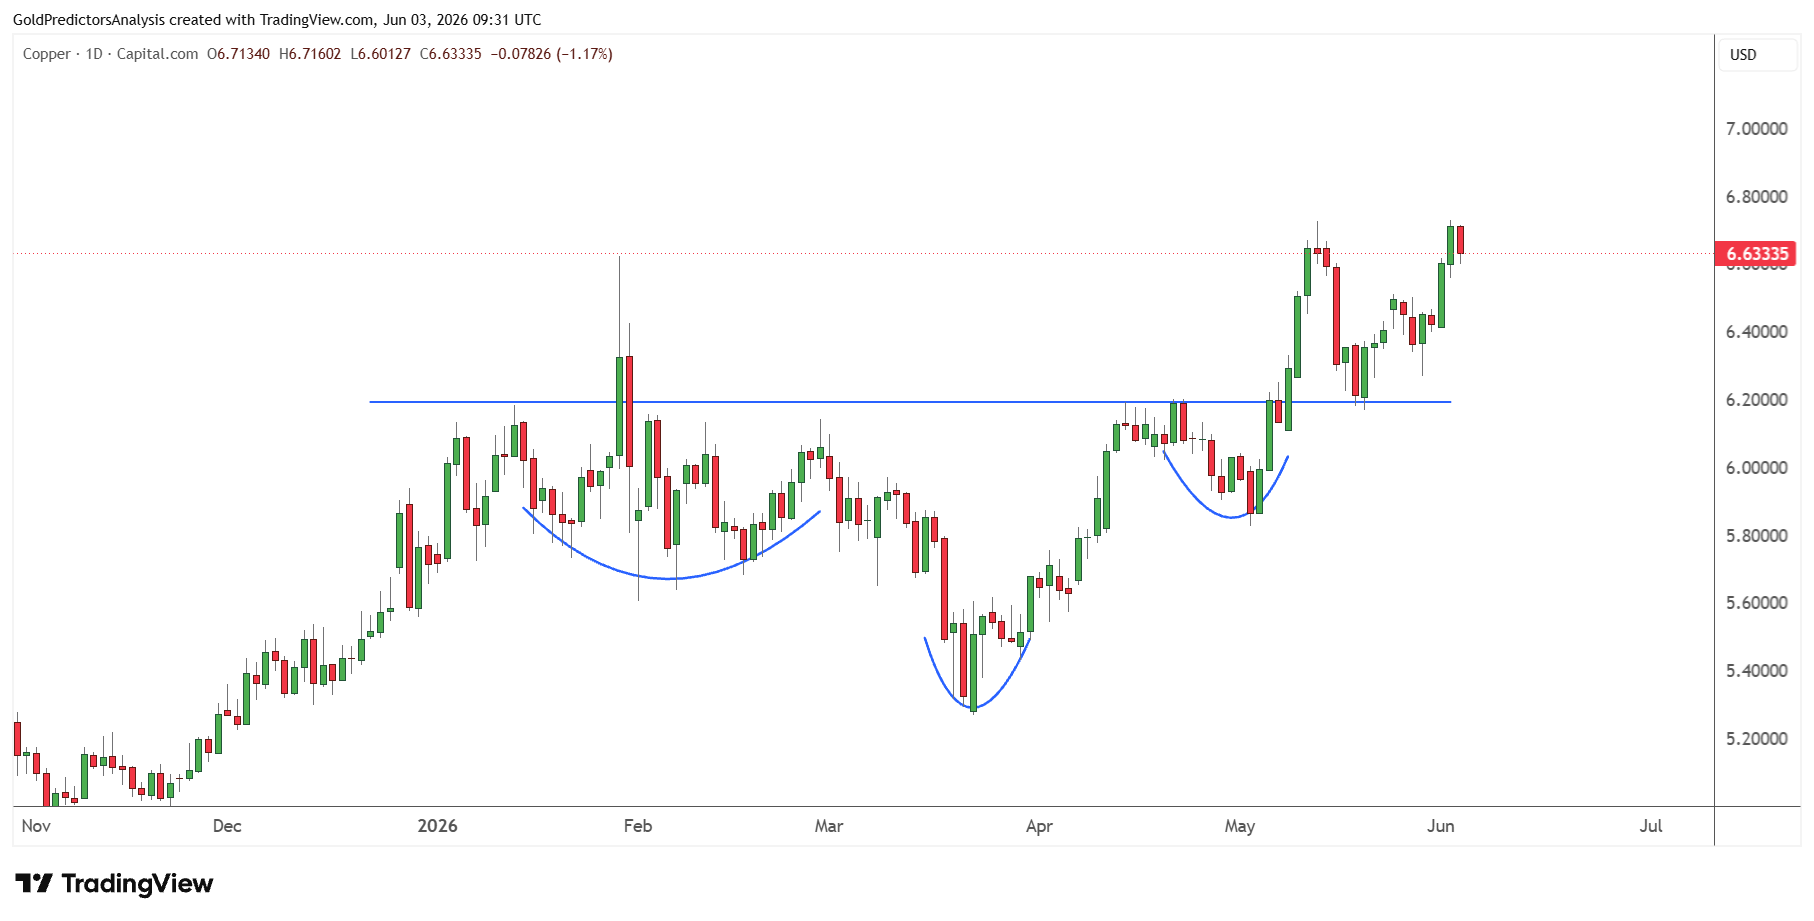
The short-term price structure for copper also remains bullish, as every time the price drops, another rally follows to push prices higher.
The latest drop in March 2026 also produced a bottom and rally toward the $6.60 level. Since the prices are already at record highs, investors may consider buying the rally at around the $6 level.
Copper prices also show a strong constructive inverted head-and-shoulders pattern from January 2026 to May 2026. This inverted head and shoulders pattern was broken at $6.20 and triggered a strong rally.
Despite this bullish price action, further correction in copper prices is likely. This correction will offer support for next surge.
Sprott Copper Miners ETF Confirms Bullish Momentum
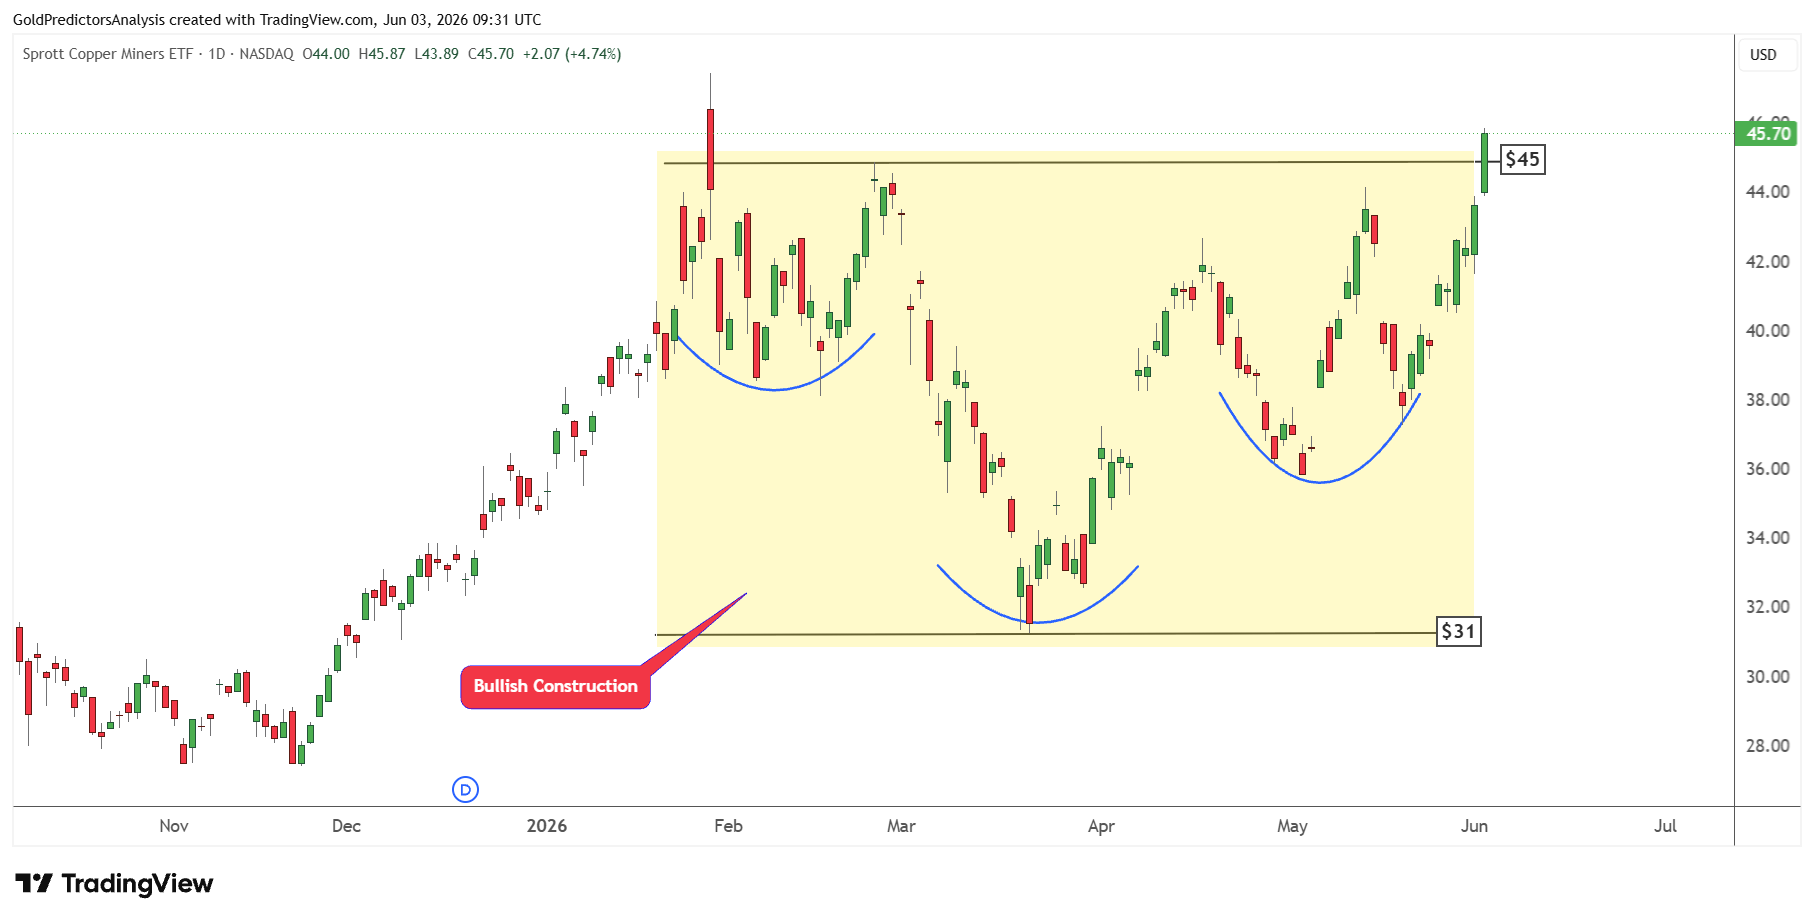
It is interesting to observe that similar bullish price action is observed in the Sprott Copper Miners ETF. The ETF has moved between $31 and $45 in 2026. But now it breaks above $45 which indicates further upside.
The formation of inverted head and shoulders in 2026 indicates that the next move in copper prices might be stronger.
Copper-to-Gold Ratio Signals Stronger Industrial Demand
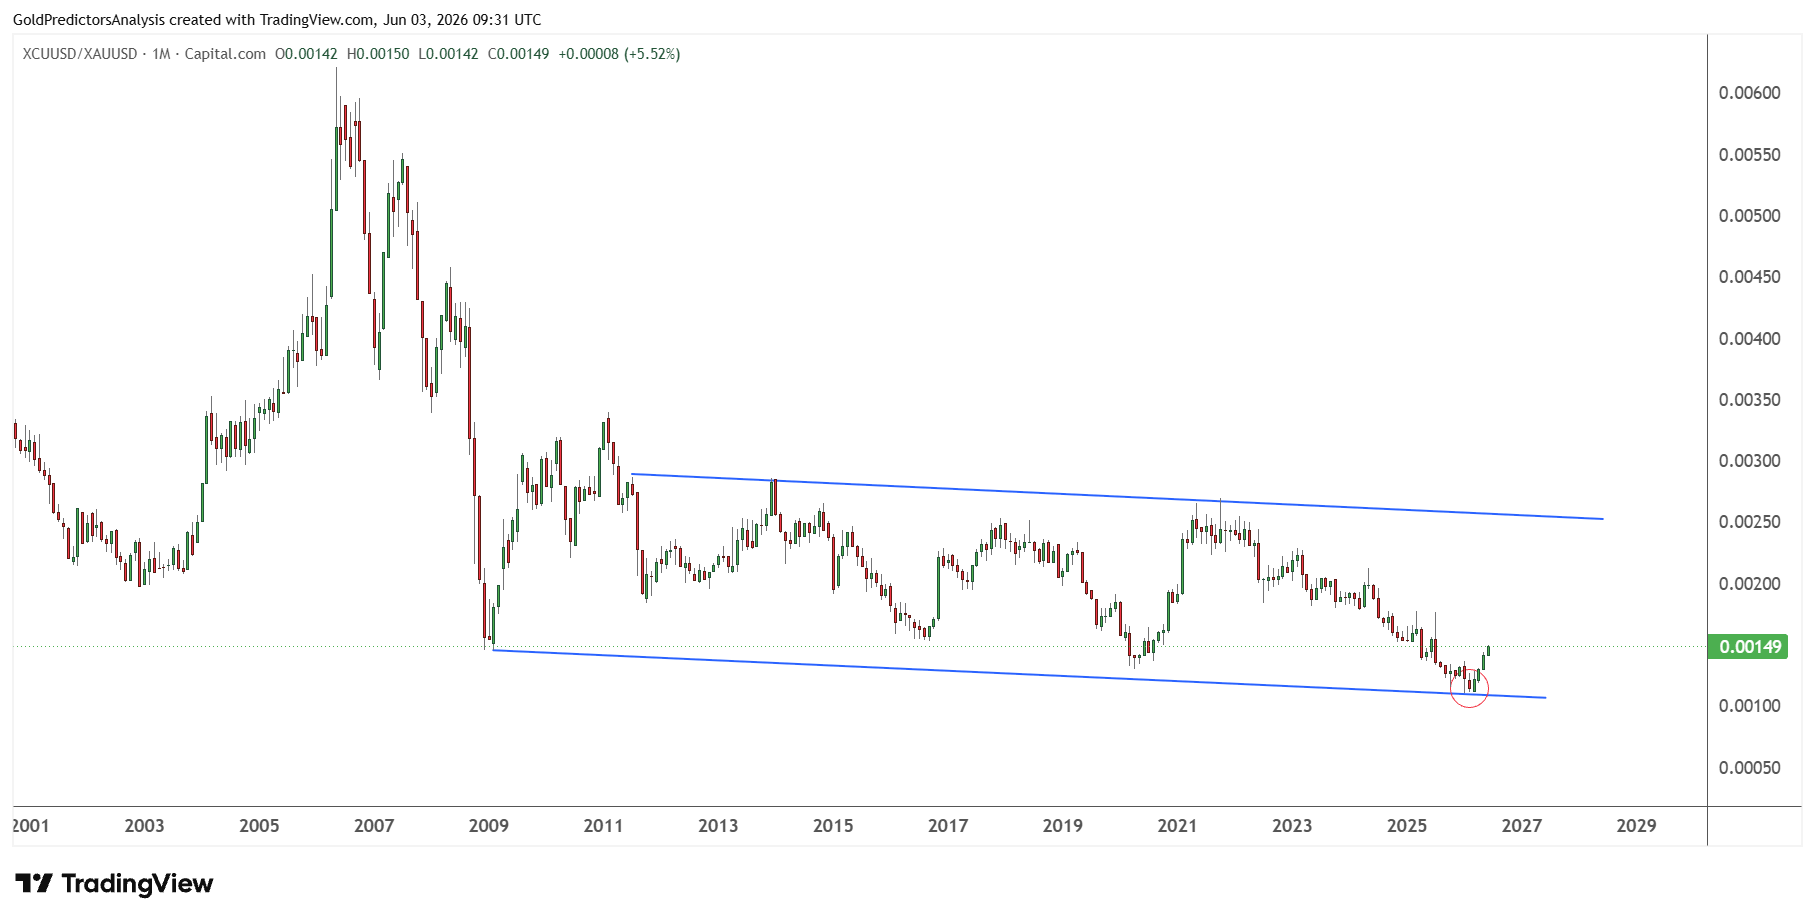
The strength in copper prices is observed using the copper to gold (XAU) ratio which has formed strong bottom at the long-term support of 0.001.
Every time the ratio hits a bottom at the trend line, it produces a bottom in copper prices and triggers a strong surge.
For example, the bottoms in February 2009 and March 2020 triggered strong rallies in both metals.
This suggests that copper prices will likely remain strong over the next few months as AI demand continues to accelerate.
In Closing
Copper prices remain in a strong long-term bull market despite the short-term price volatility. The market may receive some pressure from inflation concerns, high Treasury yields, and a stronger U.S. dollar in the short term. But the broader picture is still positive.
The global trend of supply disruption, tariff-related stockpiling, grid expansion, electrification and AI demand for data centers remains copper’s backbone. The price is challenging the important key level on the quarterly charts. The month of June must close above $6 to maintain the quarterly outlook bullish.
Another bullish sign is the breakout in the Sprott Copper Miners ETF and the positive shift in copper to gold ratio. But copper still requires bond markets to cool down and stronger recovery in China to develop real upside momentum. If these conditions become supportive, copper can outperform in the coming months as industrial and AI-related demand continue to ramp up. In my opinion, any correction in copper prices will offer investors a buying opportunity ahead of the next big move.
Read more: Trade Tension and Supply Risks Support Higher Prices in 2026