



Copper (XCU) remains strong above the key USD 6 per pound level last week as strong buying from China and optimism around US tariff decisions kept sentiment supported. However, new US-Iran tensions led to volatility in the market. In my view, this combination of tight supply, structural demand and increased geopolitical risk underpins a positive copper outlook, despite the short-term pressure exerted by increased energy prices and slowing global growth. This article provides the macro background, technical framework and market indicators that are defining the next move for copper.
Trade Risks and Geopolitics Drive Copper Volatility
Copper began last week on a solid base. Copper price remains above USD 6 per pound on Friday. The buying interest in China remains robust and sentiment is encouraged by the expectation of impending tariff decisions in the US.
The copper price dropped on Monday’s opening due to economic risks from the US-Iran tensions. The capture of an Iranian flagged ship in the Gulf of Oman and the refusal of Tehran to open the Strait of Hormuz caused panic about an even more severe energy shock. That is important to copper since higher energy can increase inflation, coupled with reduced global growth. When this occurs, industrial metals are pressured as traders become concerned about declining manufacturing and building demand.
Structural Demand and Supply Stress Support Copper
Despite those short-term macro risks, the bigger picture for copper is still favorable. Long-term structural trends are still related to demand. Electrification is still growing in the key economies. Investment in the power grid is high. Construction demand is still steady in key areas. Simultaneously, the copper outlook is also getting a boost from investor interest in artificial intelligence and digital infrastructure, as these trends demand increased power, additional wiring and more metal-intensive systems.
The situation on supply is also tight and that is contributing to the fact that copper is not pulling back despite the recent pullback. Mine disruptions, ineffective long-term investment and extremely sluggish rate of new project development have limited production. The Iran war has now posed a new supply-side threat with the sulfur market. Many SX-EW operations require the presence of sulfur and sulfuric acid to produce copper, particularly in the Democratic Republic of Congo and Chile.
Copper Price Forecast
Every new Copper analysis as it publishes, today's technical signal and key levels, live price — on one page.
See all Copper forecastsAs the Strait of Hormuz is disrupted and exporters impose export bans in countries like China and Turkey, producers are struggling with higher costs and limited availability of chemicals. That does not currently strike output right now, but it heightens the risk of reduced production in the weeks and months to come. This combination makes the copper market fundamentally tight despite macro fear, causing short-term volatility.
Copper Price Structure Remains Bullish
From a technical perspective, the copper price remains in a strong bullish trend, as seen on the monthly chart below. The copper price has formed a double bottom with the low at $1.92 in January 2016 and then the low at $1.98 in March 2020. After forming th double bottom, the price broke above $3.35 in November 2020.
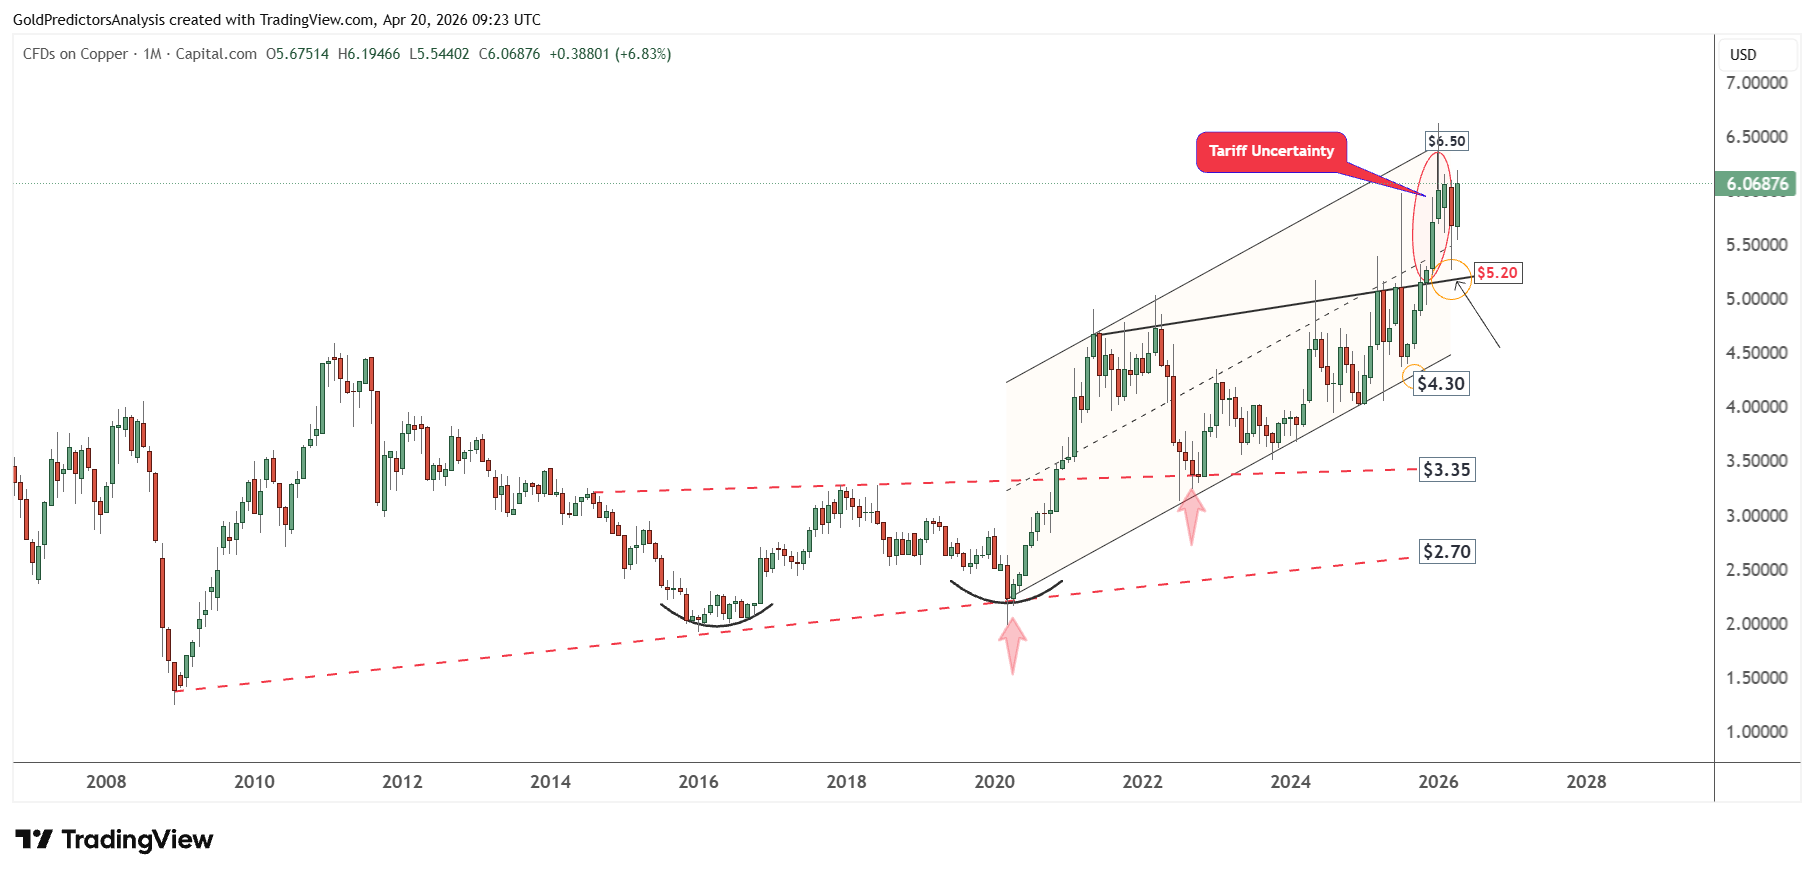
This breakout in copper has pushed the price to a new record level in January 2026 at $6.62. After the Trump inauguration, volatility remains elevated, with copper prices showing an upside bias. After hitting the record high in 2026, the price corrected back to the black trend line at $5.20 in March 2026.
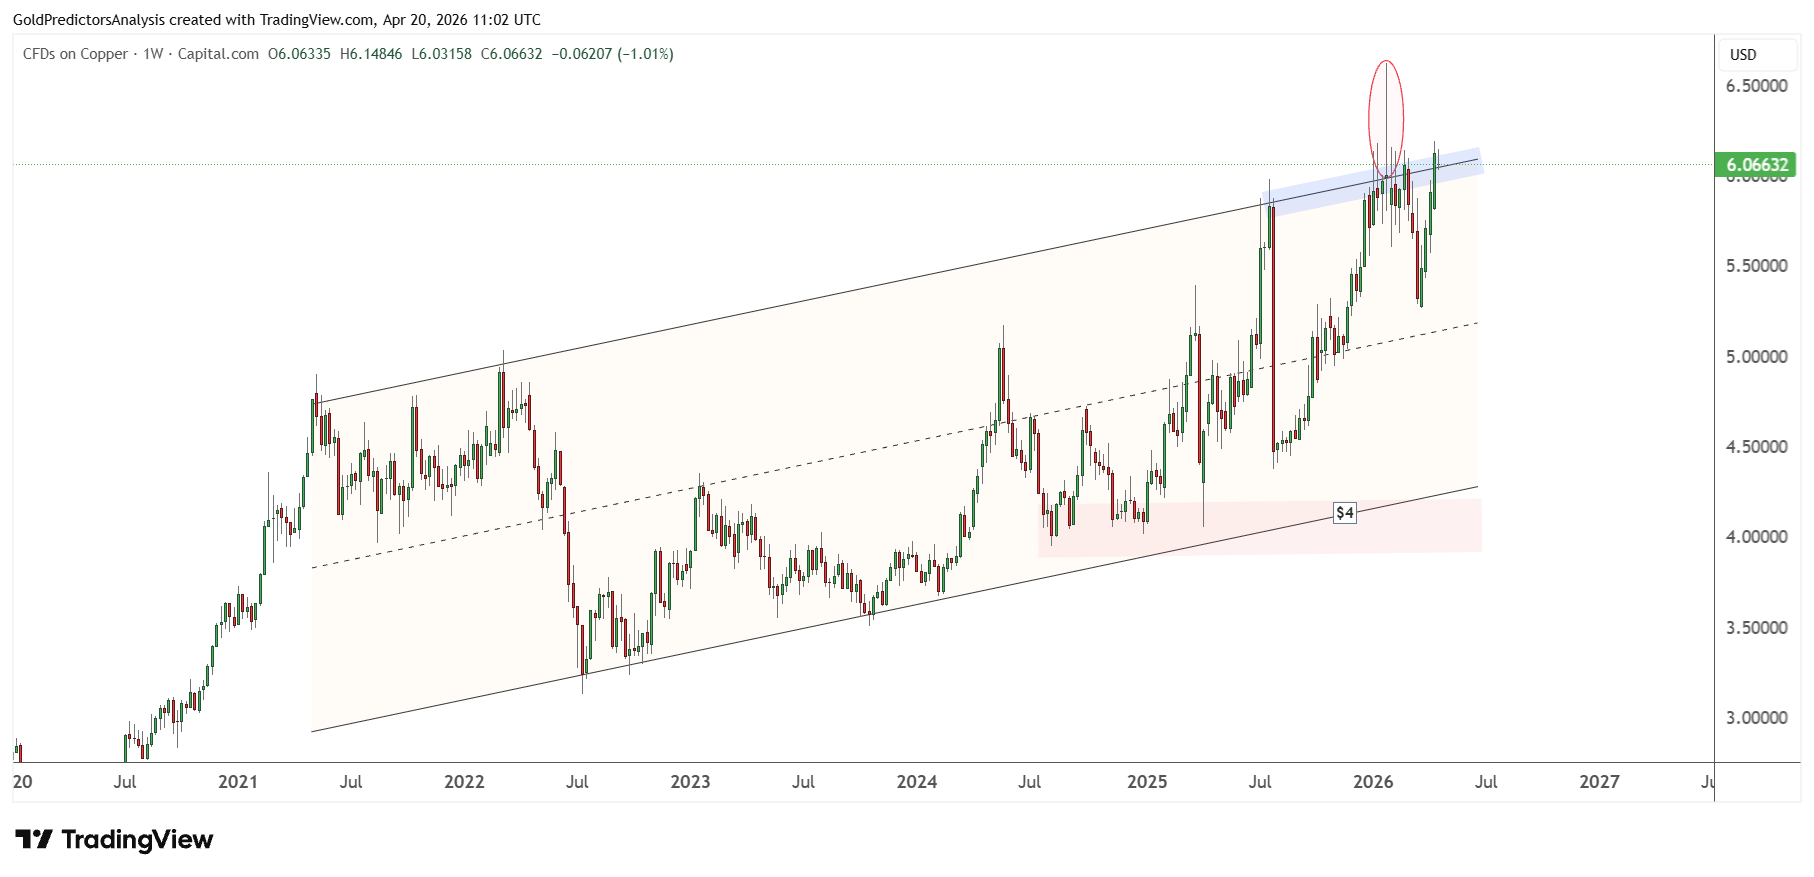
To understand the ascending channel pattern in copper prices, the weekly chart below shows that prices broke the ascending channel last week at the blue shaded area. However, copper prices remain strongly uncertain due to geopolitical uncertainty in the Middle East. If the ceasefire fails and the war escalates further, the higher energy prices will likely produce a volatile environment for the copper market. The long-term support in copper prices remains at $5.20. Any break below this level will push the prices to $4.70.
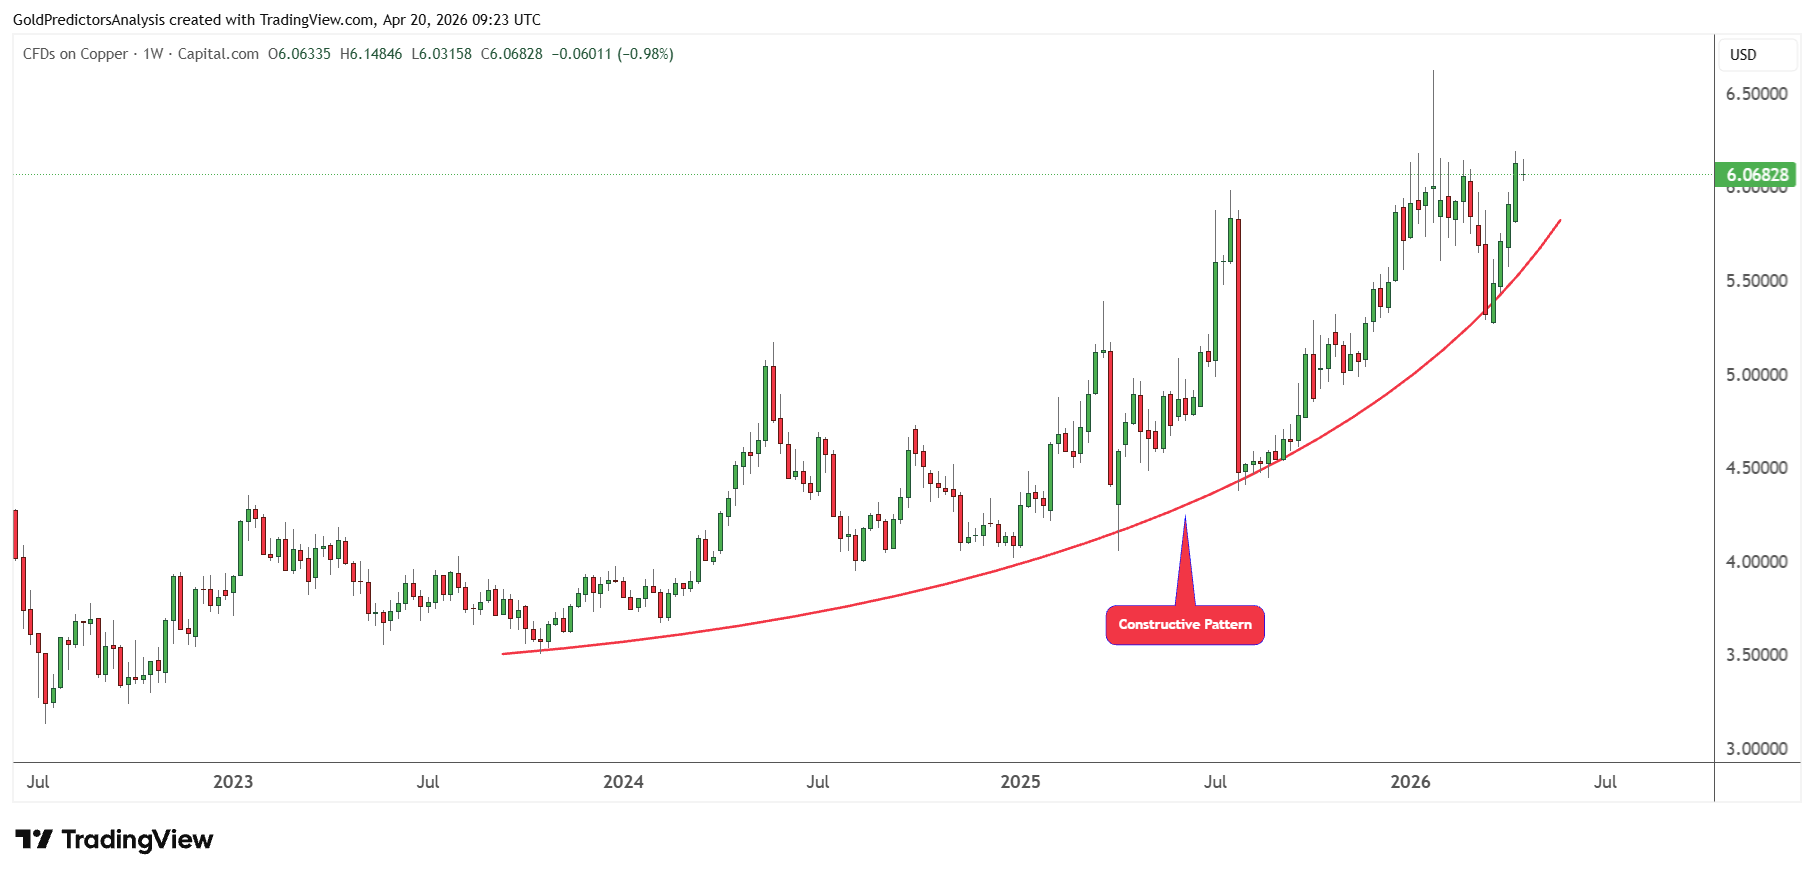
The constructive bullish structure in the copper market is also observed on the weekly chart. The prices have been trading within the bullish pattern since 2024. Each correction in the copper market has formed a bottom at the curve and then continued higher. The recent bottom was formed during March 2026 at $5.26 dollars and then prices have been trading higher during the past four weeks. This indicates further upside potential in copper prices.
US Dollar Trend Supports the Copper View
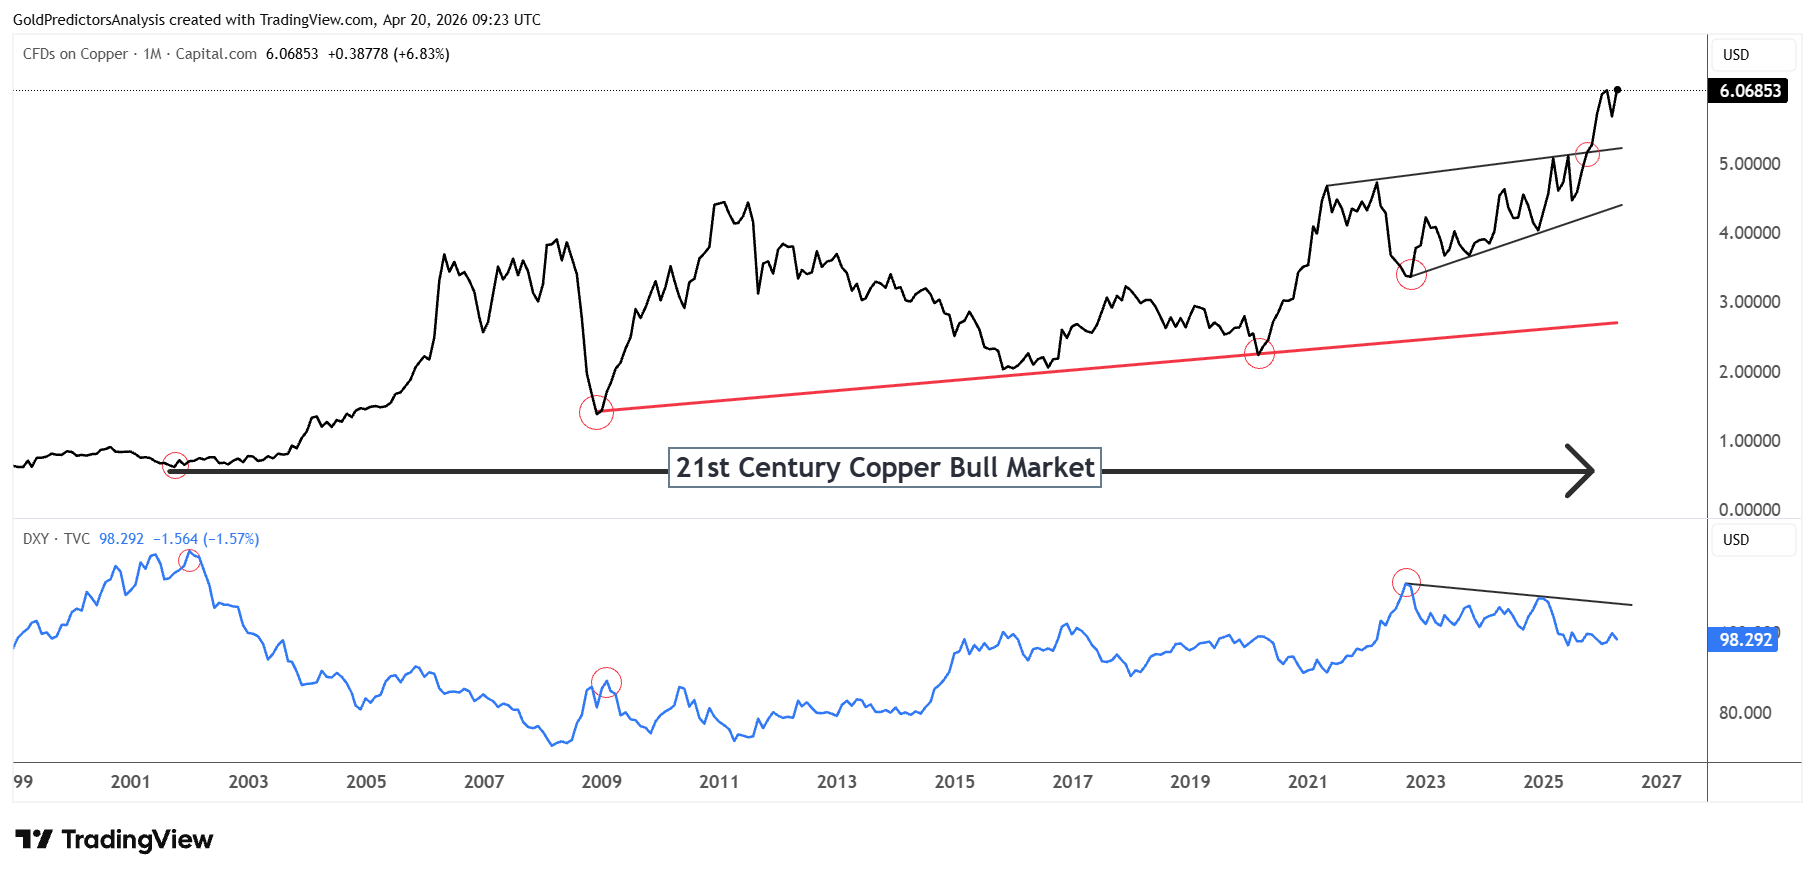
The US dollar remains one of the most important outside signals for copper. The chart below shows that the US dollar index has continued to consolidate in a weaker pattern in the 21st century. However, copper has remained in a bull market in the 21st century. The peaks and bottoms in copper are aligned with the US dollar index. It shows that both assets have an inverse correlation. The bottom in copper during the Great Recession crisis in 2008 produced a peak in US Dollar.
The recent peak in the US dollar index in 2022 has led to a strong bottom in the copper market, with the trend having broken higher above the $5 area. The negative trend after the 2022 in US dollar index peak has kept positive momentum in copper prices. In my view, this signal supports the broader copper thesis.
The dollar is rising after the US-Iran crisis on safe-haven demand but it is no longer acting as a strong headwind for copper. That gives copper more room to stay firm when supply remains tight and structural demand stays strong. As long as the US dollar index remains under pressure or moves sideways, the broader environment still favors copper holding higher levels. It could also support an extension of the long term breakout.
Risks to the Copper Outlook
The biggest short-term threat to copper is a further blow to the world economy. The US-Iran conflict has already increased the stress on the energy market. Any additional interference in the Strait of Hormuz may raise the oil prices further. That would increase the inflation pressure and press manufacturers simultaneously. In case of slow growth, the construction industry and trade sensitive demand for copper might be affected. An increased US dollar in risk-off flows would be additional pressure and may reduce the recent rise in copper.
Another risk comes from the price volatility due to the tariffs and war. The long-term setup remains bullish, but the market is fragile to war news, tariff news and shifts in sentiment. If the copper price fails to hold $5.20, the correction may continue further. Meanwhile, supply pressure due to sulfuric acid shortages might not be able to underpin prices in the short term, in case traders shift their attention to recession risk. That sets a challenging stage on which bullish supply factors and bearish macro anxieties may collide in the short-run.
In Closing
Copper continues to be supported by a good long-term story. Demand is still linked to electrification, power grid expansion, construction work and development of AI and digital infrastructure. Meanwhile, supply is restricted due to mine disruptions, poor long-term investment, and slow project development which limit production. The sulfur problem associated with the Strait of Hormuz is an additional supply risk. This risk further supports the long-term bullish view in copper despite the short-term headlines that trigger sharp swings.
Nonetheless, there is no risk-free market. Copper is very responsive to war headlines, tariff decisions and changes in the global growth expectations. The technical development continues to indicate bullish prospects, though volatility remains high. A break below major support at around $5.20 may undermine the perspectives and open the doors to further correction. I believe that the bigger picture trend is still in favor of copper strength, but the short term direction is uncertain due to the supply tightness and macro fear.