


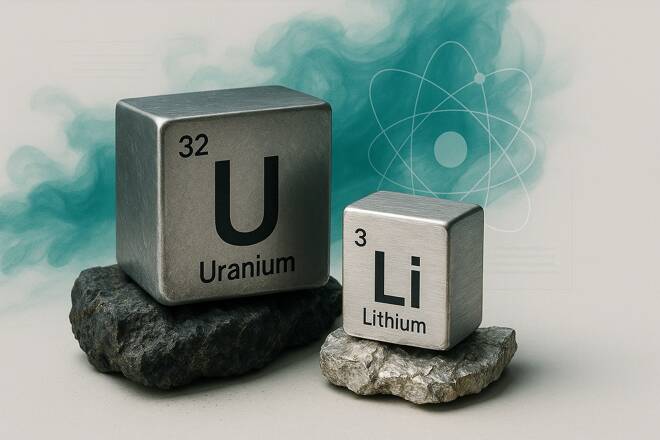
Energy metals have pulled back as the U.S. dollar holds firm, oil prices rise and Fed rate hike expectations increase. In my view, this correction may set the stage for the next upside move in copper (XCU), uranium, lithium and silver (XAG) if key support levels hold. This article discusses the macro drivers, major support zones in metals and ETFs and the signals that may drive the next move.
Dollar Strength and Oil Prices Pressure Energy Metals
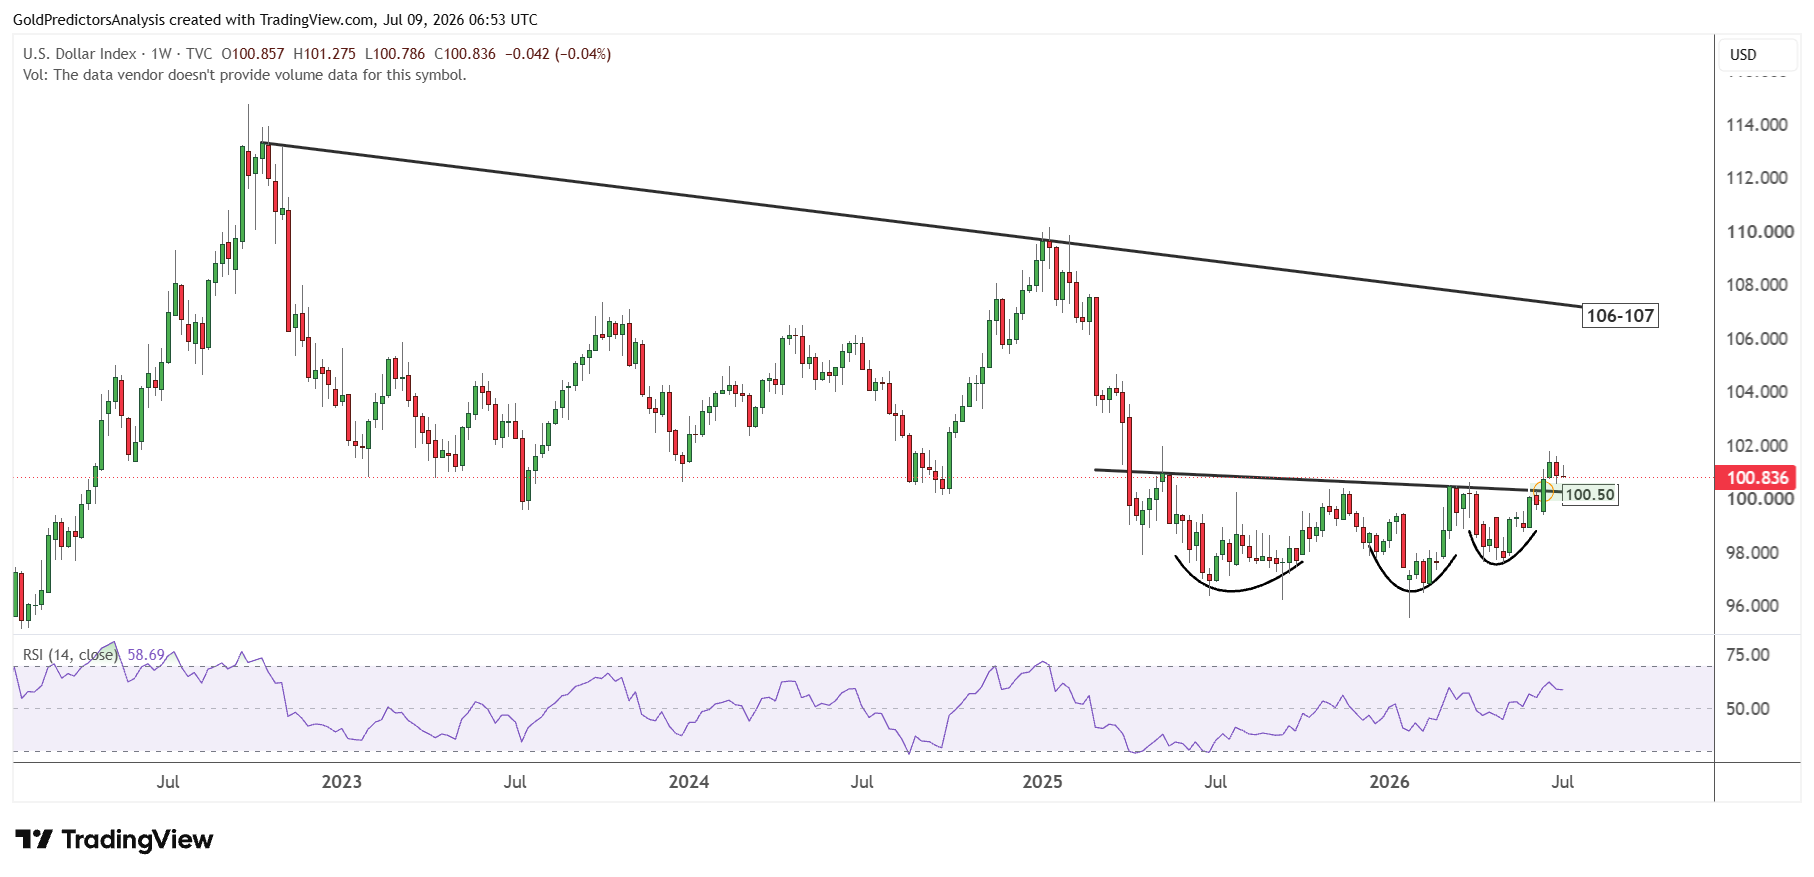
The macro backdrop has been changing rapidly due to renewed tensions in the Gulf. The U.S. dollar was unchanged as investors returned to safe haven assets. The US dollar index is consolidating above 100.50. As long as this support level holds, the next move may develop towards the 104 level. This is significant for the energy metals as a strong US dollar may limit the rally in the commodities.
The chart below shows a breakout in the US dollar index at 100.50 after the formation of a bullish price structure above the 96 level.
Another big factor in markets is oil prices. After the latest escalation between the U.S. and Iran, Brent crude reached near the $80 a barrel. This rally was a reminder of the inflation risk. Increased oil prices can lead to an increase in the costs of transport, production and energy. That may negatively impact the demand expectations for industrial metals like copper and lithium. This can also put pressure on central banks to remain hawkish.
Copper Price Forecast
Every new Copper analysis as it publishes, today's technical signal and key levels, live price — on one page.
See all Copper forecastsFed Rate Hike Bets Split Copper, Lithium and Uranium Outlook
The expectations of interest rates were another big factor. Traders factored in a higher likelihood of a Fed rate hike this year. This sends the U.S. Treasury yields higher as oil prices jumped. June FOMC minutes also showed a hawkish split as policymakers were concerned about the inflation. The metal prices benefit from lower yields and a weaker dollar. This is important for copper, lithium and silver as these markets are susceptible to the global liquidity and risk appetite.
Uranium may act differently from other energy metals. The metal is closely linked to the demand for nuclear energy and long term energy security. Investors may continue to turn to nuclear power as a stable energy source if Gulf tensions continue to keep the oil prices high. This can help uranium related assets to benefit when other metals are under strain due to higher yields.
Overall, the key catalyst for the energy metals is the combination of Gulf risk and oil prices, U.S. dollar and Fed rate expectations. Copper and lithium might remain sensitive to growth and liquidity concerns. Silver could remain wedged in a holding pattern between safe haven demand and dollar strength. The energy security theme could continue to underpin uranium. Energy metals will likely take their next direction from the U.S. dollar and oil prices.
Copper Tests Support as Bullish Consolidation Holds
Copper prices continue to consolidate within a bullish structure below the 50-day SMA with no clear direction in the short term. The reversal from the $6.70 level indicates that prices are looking weak in the short term due to a strong dollar.
The immediate support remains at $5.90. However, a break below $5.90 will push the price towards $5.79, which is the 200-day SMA. The RSI also remains below the mid-level and looks likely to drop further before the next rally.
But the V-shaped recovery pattern above the 200-day SMA and the overall bullish structure on the weekly and monthly charts indicate that prices are still within broader bullish setup.
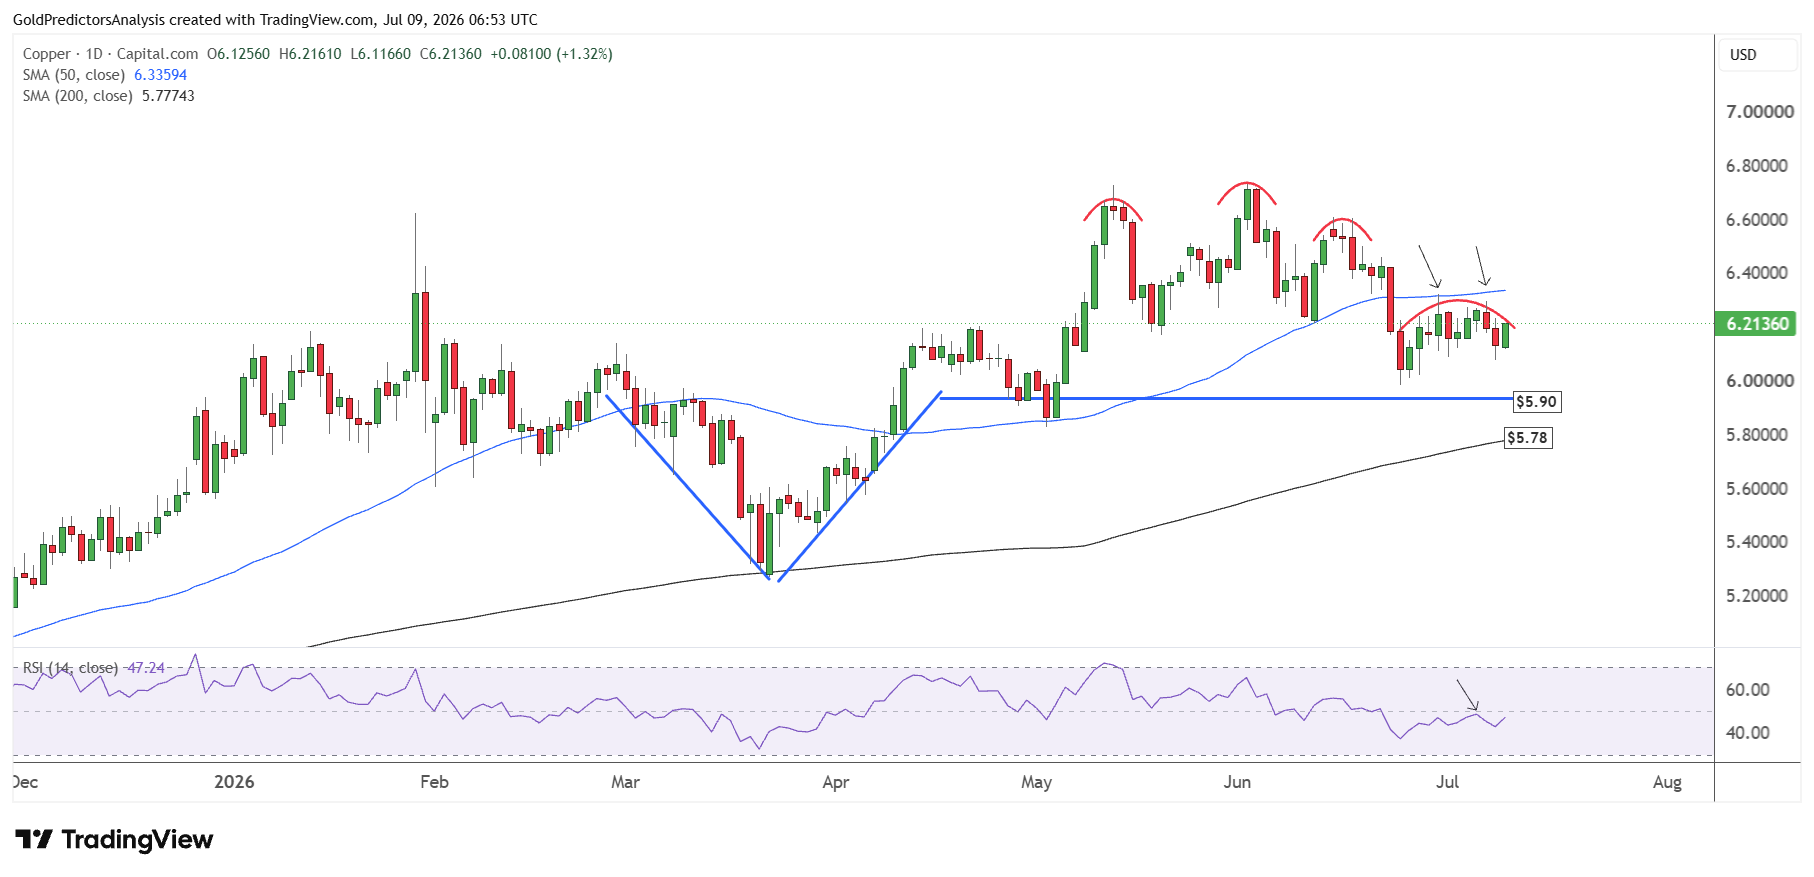
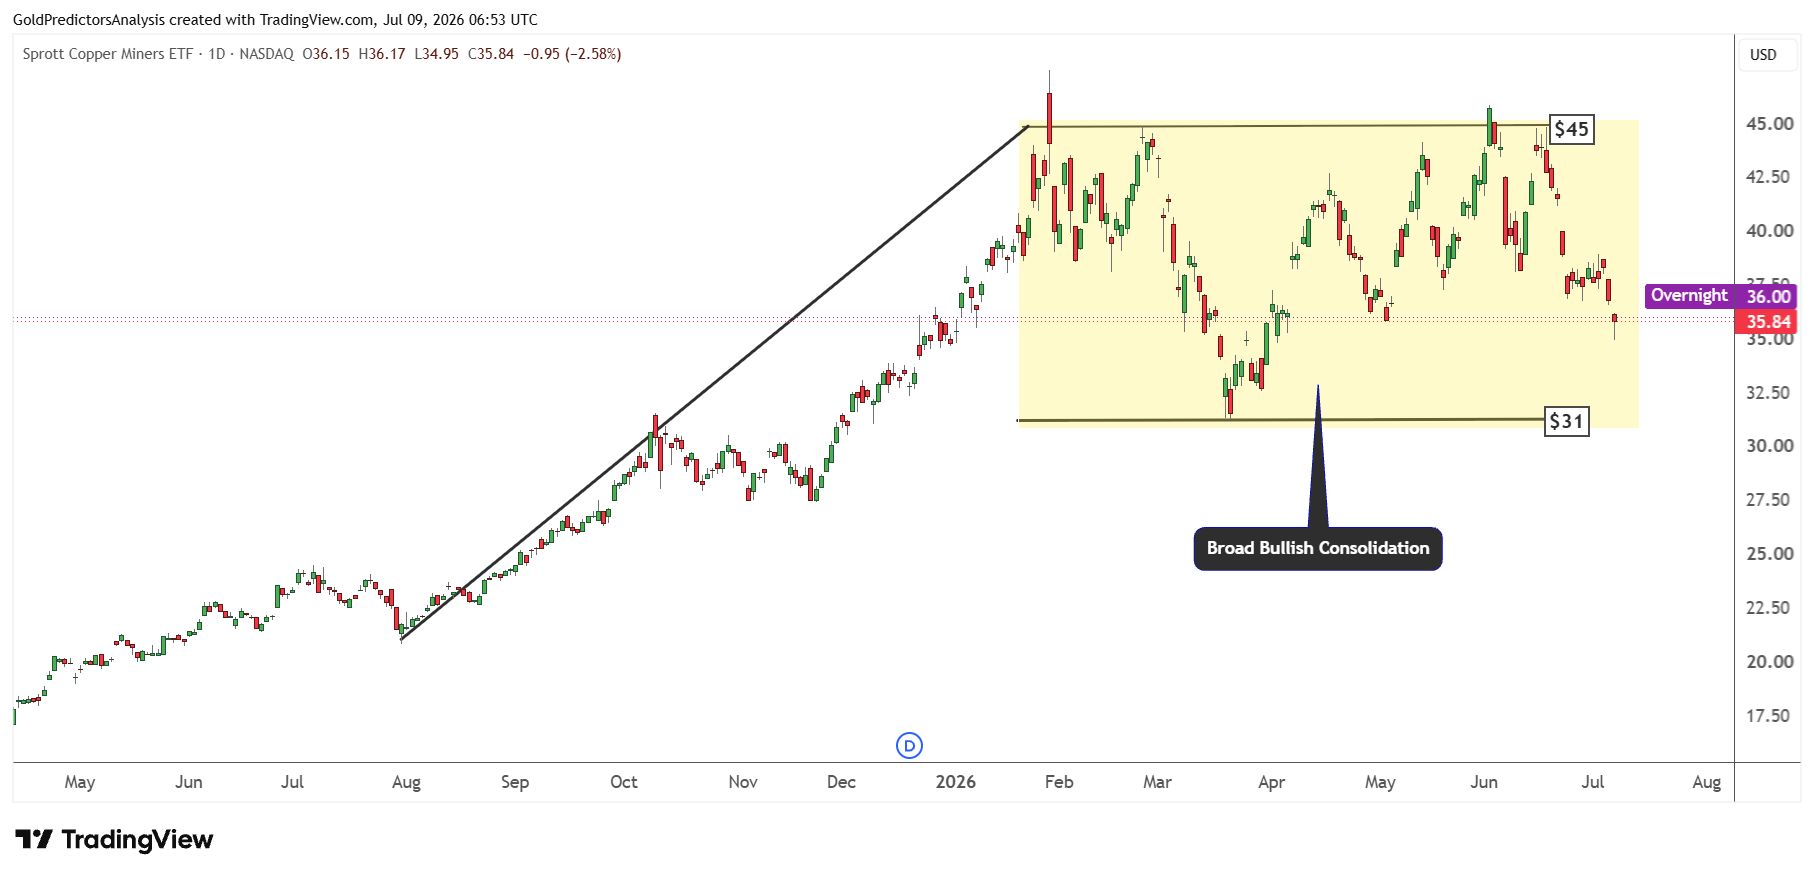
The controlled pullback suggests that the correction in copper prices will likely be considered a buying opportunity for investors. The strong consolidation in copper prices is also evident on the Sprott Copper Miners ETF as seen in the daily chart below.
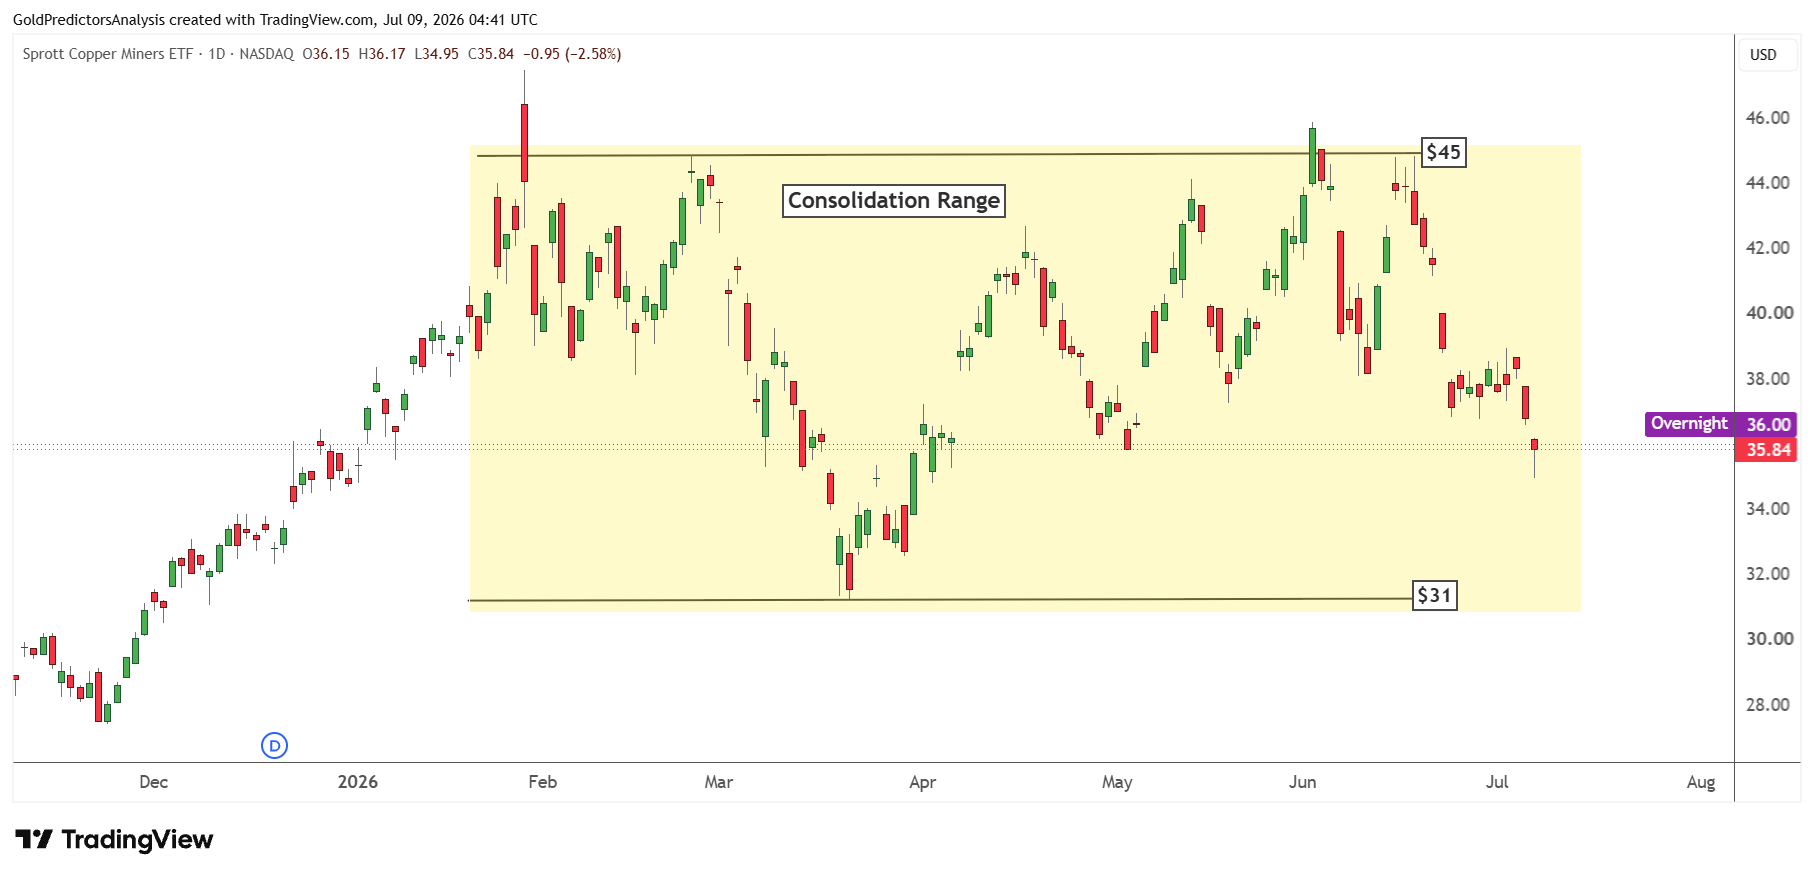
This consolidation remains between $31 and $45. A break of either of these levels is required to push the copper market in the next direction.
But on the broader scale, the consolidation between $31 and $45 is a bullish consolidation pattern that formed from the lows of July 2025 to the highs of January 2026. The strong rally in 2025 and then the bullish consolidation indicate that a break above $45 in the Sprott Copper Miners ETF will likely initiate strong surge in the copper market.
Uranium Bull Flag Approaches Key Support
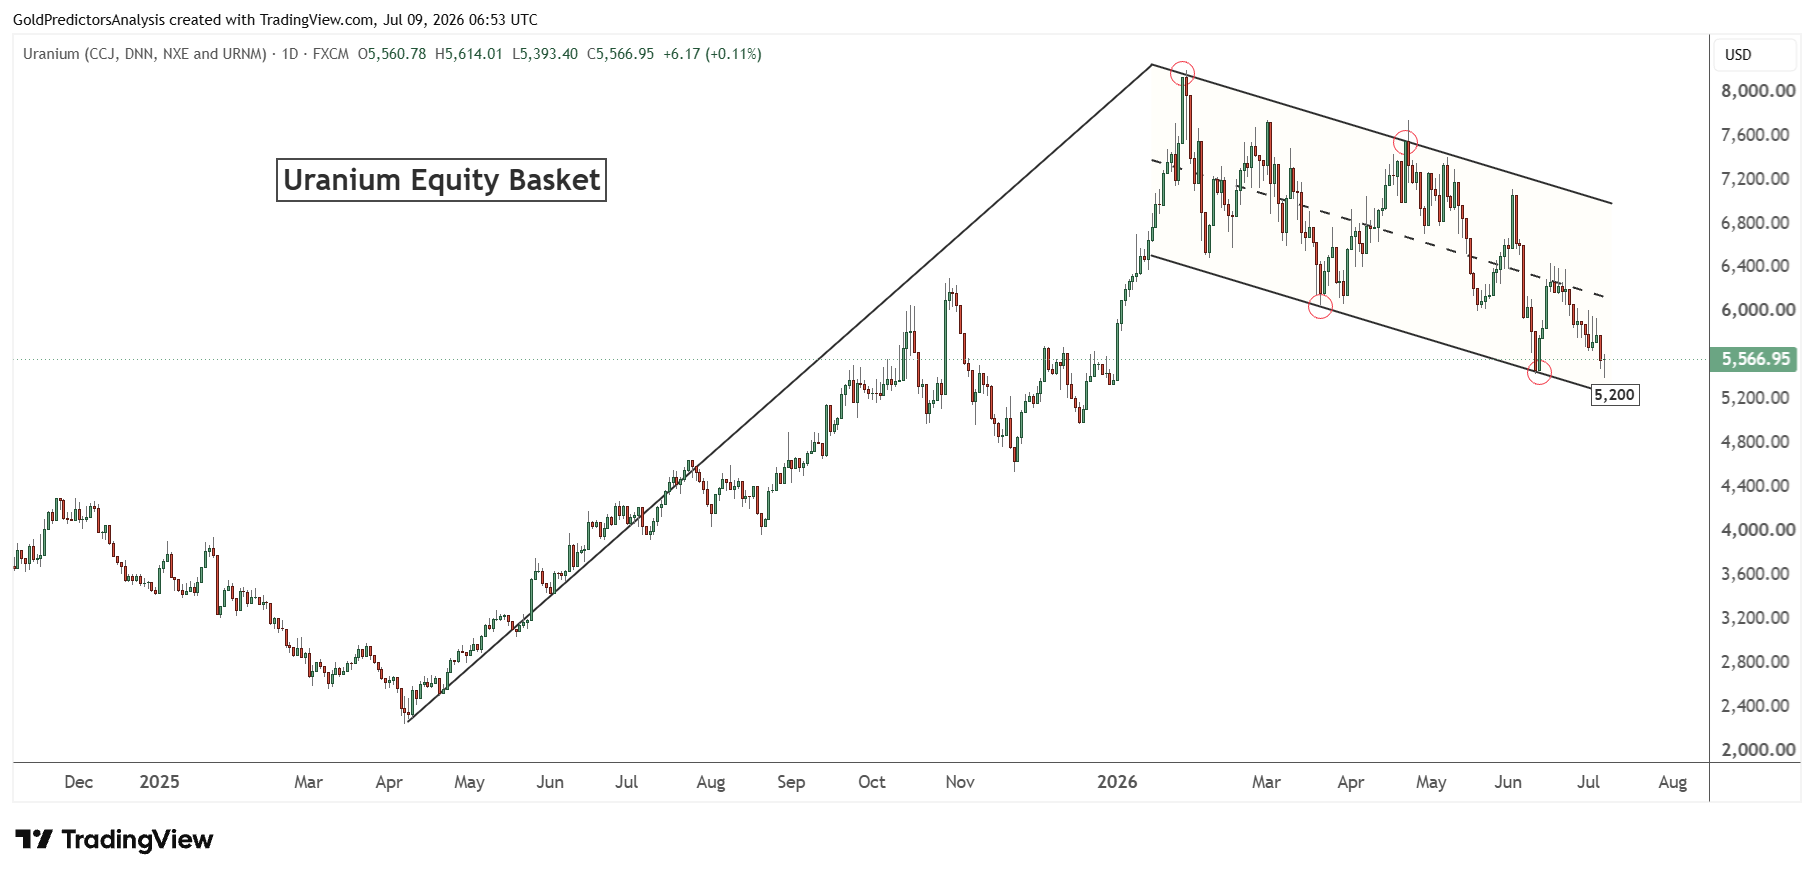
Uranium prices are also dropping along with other energy metals, but the prices are approaching key support levels. The uranium equity basket is dropping after marking a record high in January 2026. But it is now approaching the key level of 5,200.
This is considered strong support of the descending channel pattern. This descending channel pattern is considered a bull flag pattern when measured from the lows of April 2025.
If this uranium equity basket maintains the 5,200 level and breaks above the 7,000 area, it will likely trigger a strong surge in the uranium market back towards 10,000.
The uranium markets are approaching key support levels as seen in the broader uranium market ETFs. Global X Uranium ETF is now consolidating around the $42 area which is considered strong support of the triangle.
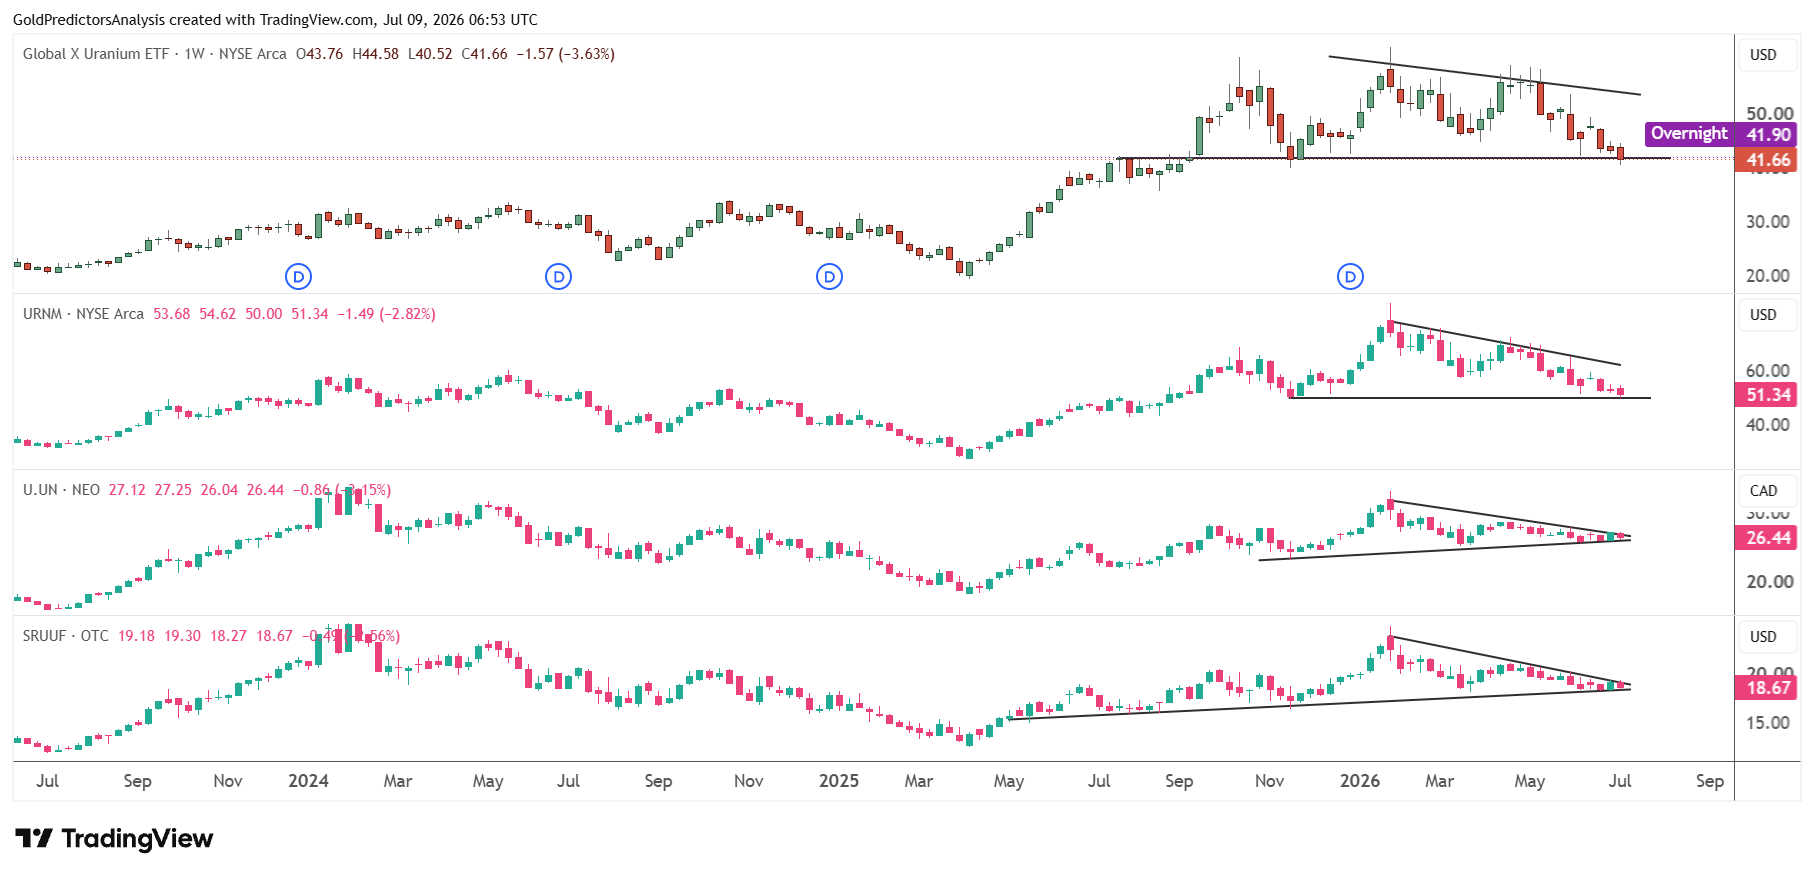
Sprott Uranium Miners ETF is also consolidating at the strong support of $50. On the other hand, Sprott Physical Uranium Trust is consolidating at the edge of the triangle pattern around $25. A break below these support levels will trigger another strong drop in uranium. But if the support level holds, then the next move in uranium will be higher if the triangle pattern breaks to the upside.
Lithium Miners Test Major Support Levels
Lithium prices also continue to drop after a strong rally in May 2026. The chart below shows that the lithium market is approaching the key support levels in miners.
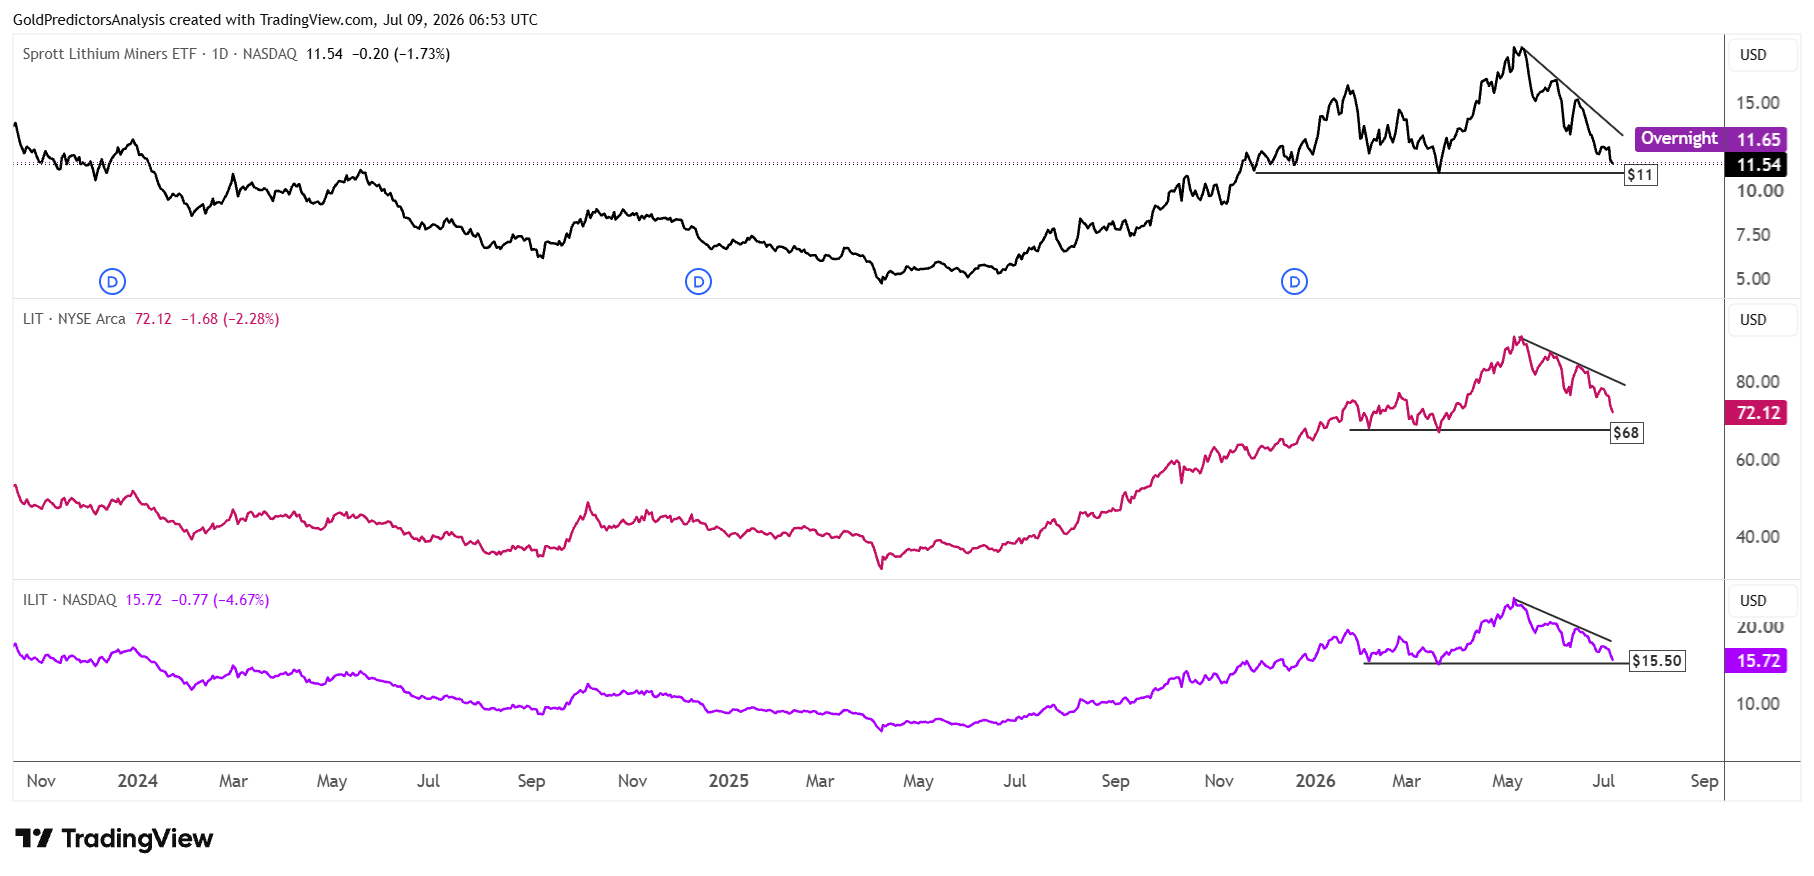
The Sprott Lithium Miners ETF is approaching the key support of $11. Global X Lithium and Battery Tech ETF is approaching the support of $68. iShares Lithium Miners and Producers ETF is approaching the $15.50 support level. A break below these support levels will trigger a further drop in the lithium market.
But a breakout above this triangle will likely trigger the next strong surge in the lithium market.
The strong support in the Sprott Lithium Miners ETF is evident on the daily chart. The chart shows that the price is approaching the $11 level. A break below $11 will likely push further downside towards the $9 level.
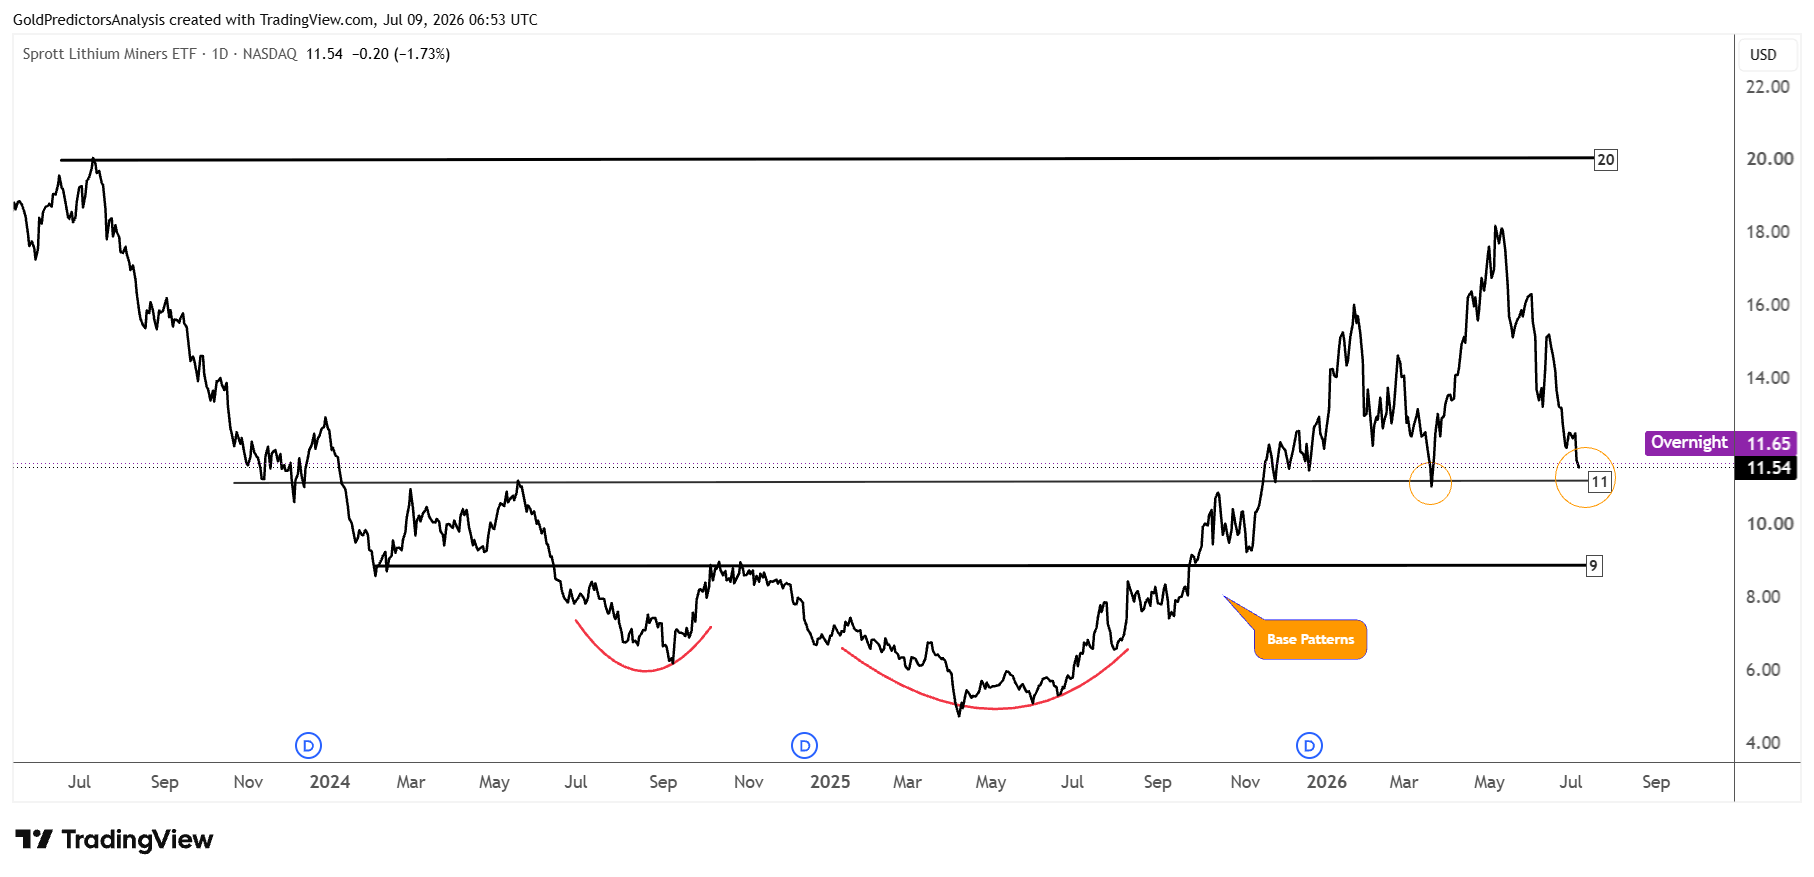
However, the strong bullish structure since 2024 and 2025 suggests that this correction may be considered as preparation for the next strong upside move. The strong resistance in the Sprott Lithium Miners ETF is at $20.
Sprott Critical Materials ETF Tests Key Breakout Zone
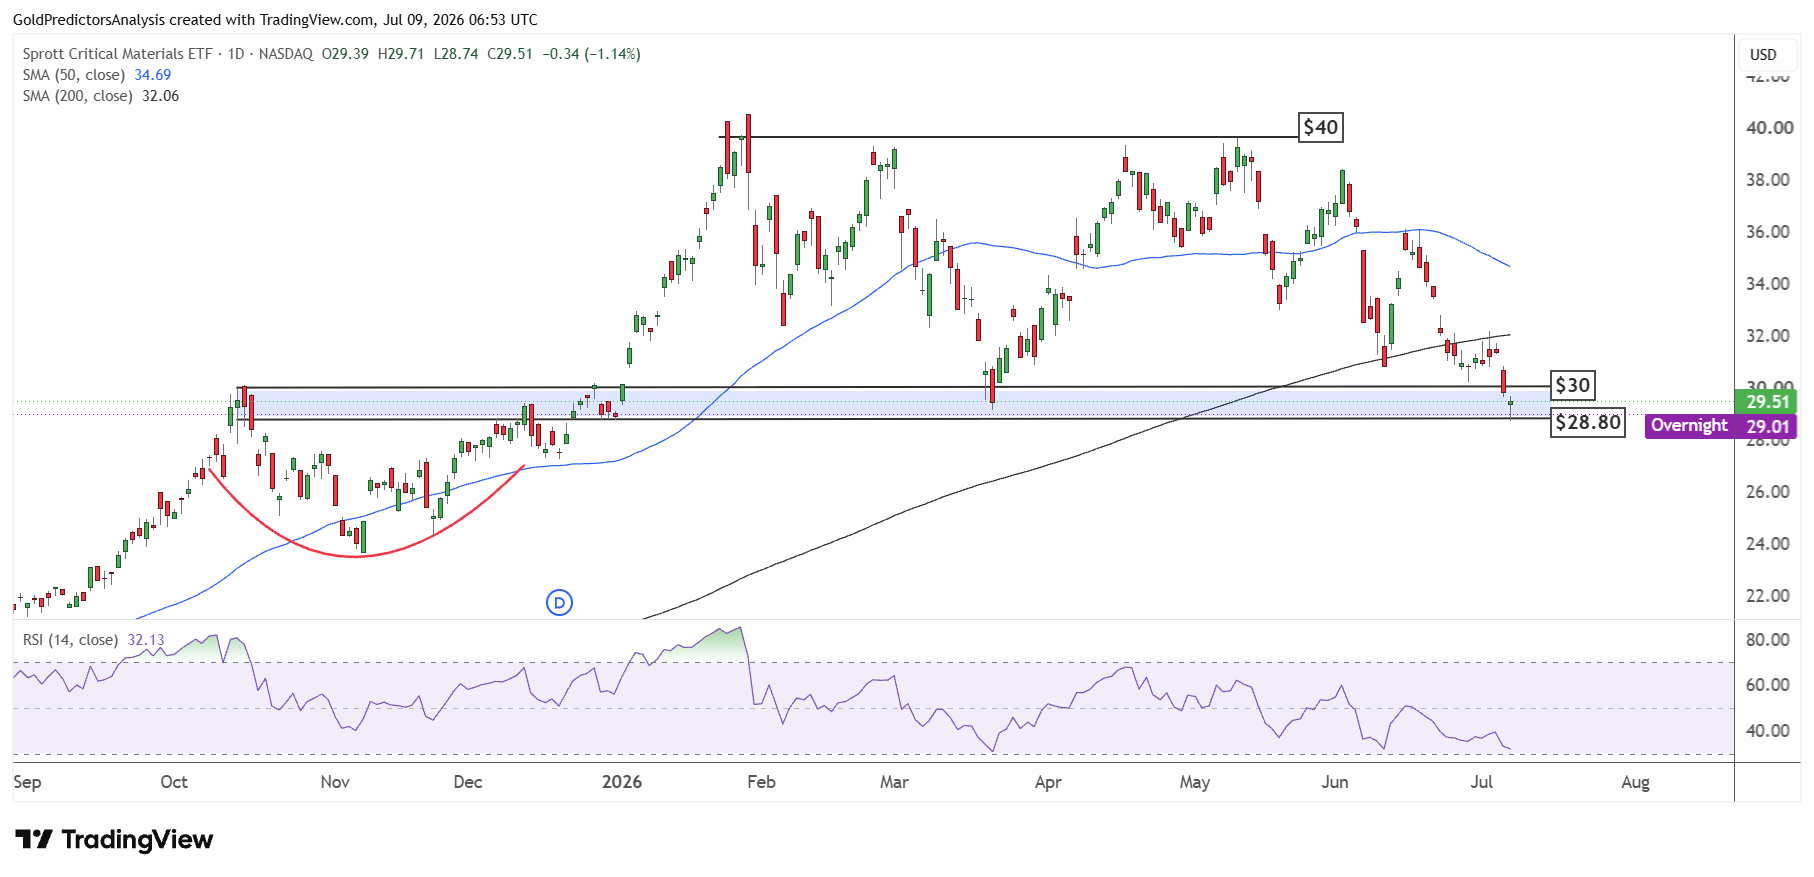
The Sprott Critical Materials ETF is consolidating at a critical key level of $28.80 to $30. A break below $28.80 will likely trigger another strong drop in the Sprott Critical Materials ETF. The strong U.S. dollar and Fed rate hike expectations support this drop.
But if there is a rebound back above the 200-day SMA at the $32 area, it will likely continue the next upward move. Despite the negative price action in June, the materials ETF may continue to rise.
Silver and Copper Ratio Nears a Turning Point
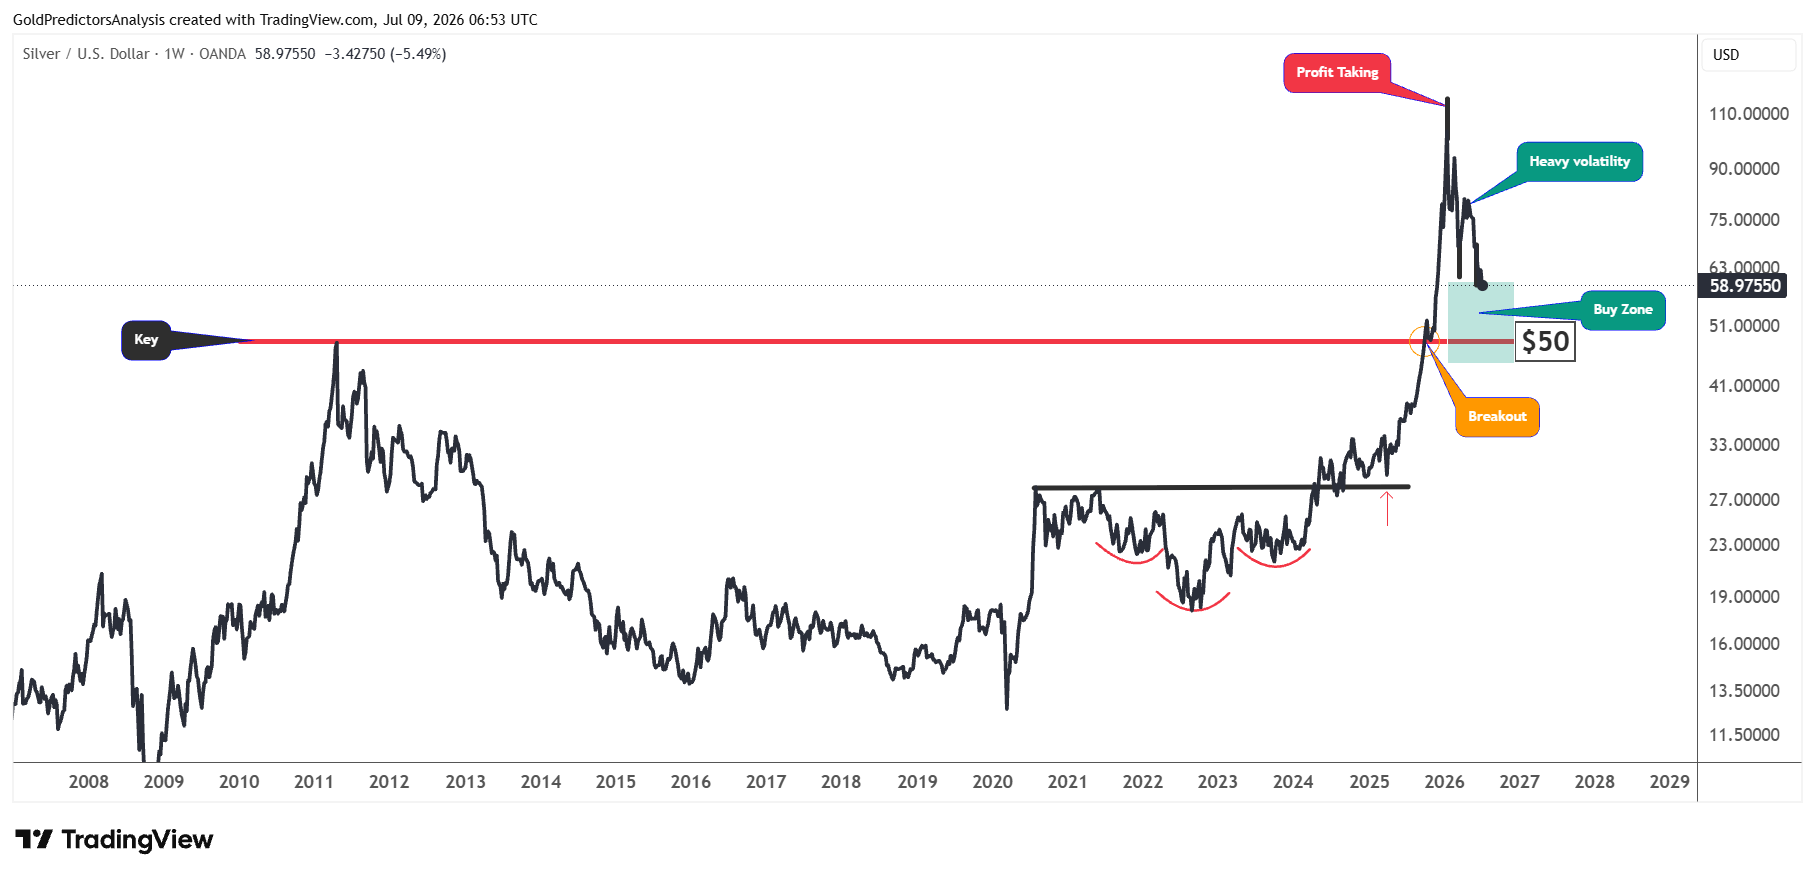
Silver prices have also fallen after hitting a record high at $120 due to profit taking. The heavy volatility has pushed the silver price to the major buy zone near $50. The emergence of the inverted head and shoulders patterns and then the breakout above the decade resistance of $50 indicates that this correction will be considered a strong buying opportunity.
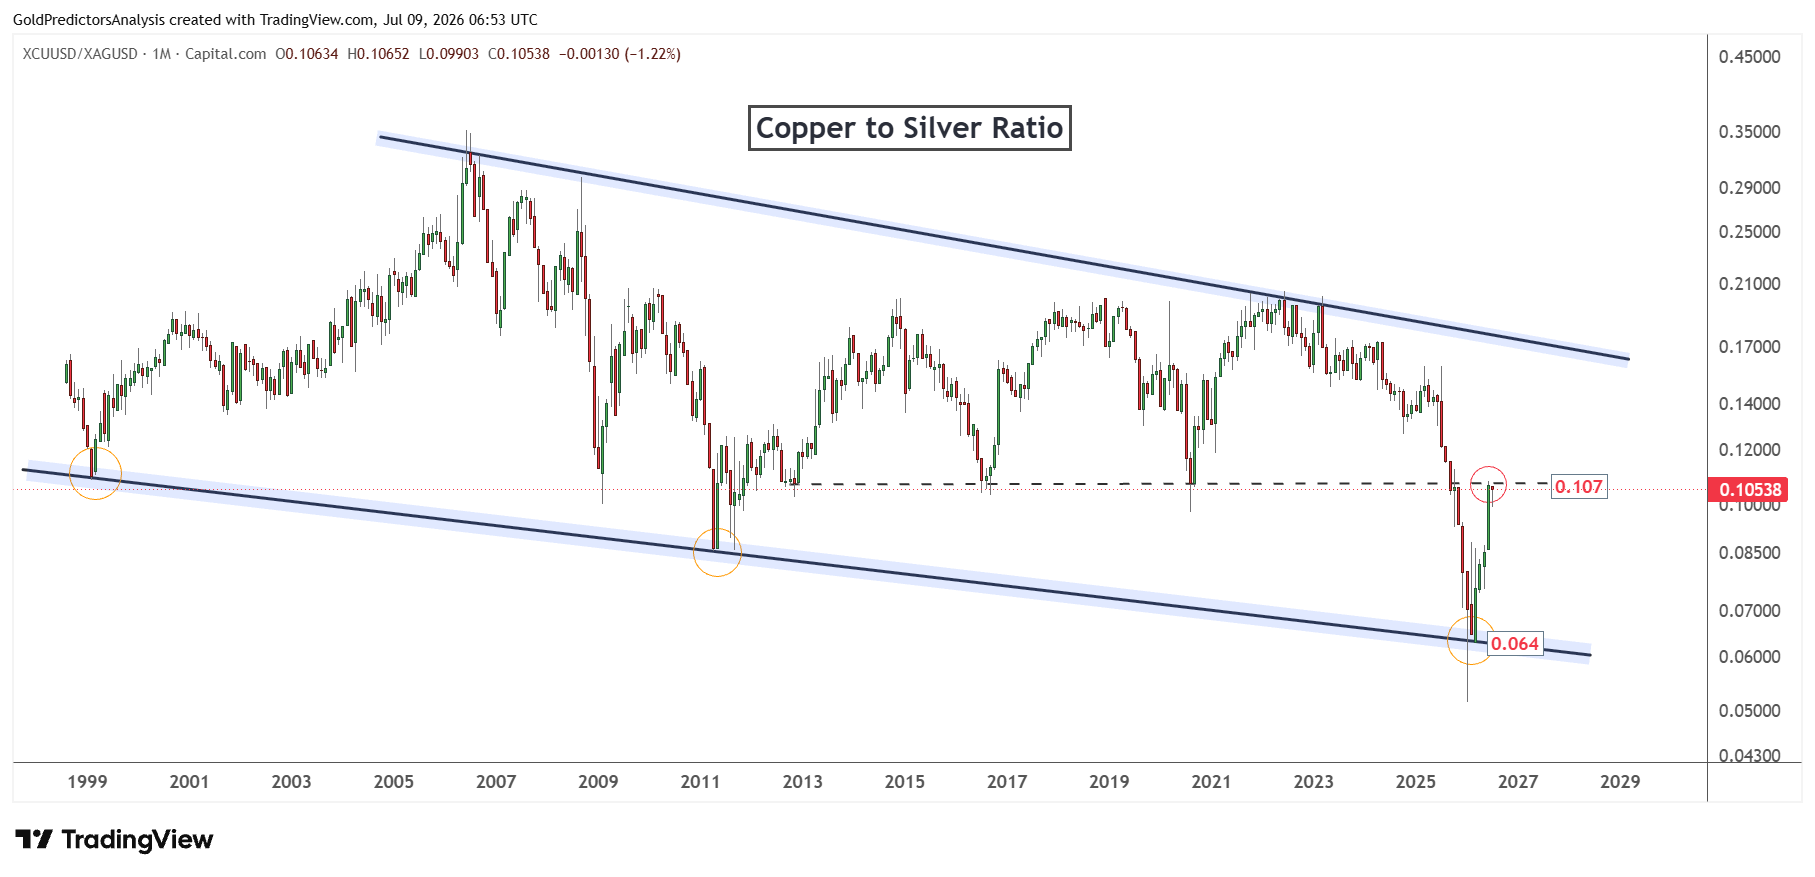
But the strong surge in copper prices in 2026 has pushed the copper to silver ratio towards the major pivot of 0.107. This indicates that copper maintained its strength in 2026 which might be due to strong development in AI.
The copper prices will lead silver if the ratio breaks above 0.107. But it is also interesting to note that as the copper to silver ratio approaches resistance, silver prices are approaching the key support zone of $50. This suggests that the possibility of silver producing a bottom at $50 increases as copper prices face resistance.
Final Thoughts
Energy metals remain under pressure as the U.S. dollar holds steady and oil prices continue to threaten inflation. Copper, lithium and silver are still sensitive to rate hikes and liquidity concerns, while uranium has the potential to receive continued energy security support. The long-term outlook remains positive, but the short term outlook is mixed as most metals trade in a range and test important support levels.
The next step in metals will depend on whether these support zones hold. Copper and lithium may recover if the US dollar starts to correct lower and risk appetite improves. Uranium may remain strong if the demand for nuclear energy remains high. Silver is also approaching the key support level of $50 as the copprt to silver ratio approaches the pivotal zone.
Overall, the energy metals show pressure in the short term, but the market is approaching the key support levels. If these support levels hold, the next move will likely be higher.