



Ethereum (ETH-USD) has spent most of 2026 doing what it has done for the two years prior: underperform Bitcoin (BTC-USD) and frustrating anyone who thought the spot ETF launch in mid-2024 would deliver the same kind of structural rerating it gave BTC. Fool me once, as they say. ETH is now trading at ~$2,250, down significantly from its peak of ~$5,000 back in September. The recent breakout attempt has just failed, with ETH unable to hold its 50-EMA, and the bulls are now on the defense without an obvious macro catalyst to lean on in the near term. The question now is whether the next leg of support holds or whether ETH heads back to $2,000 and then $1,800-1,750 below that, below the price of many buyers of the last few years.
ETH Has Been The Underperformer Of The Cycle
The ETH-BTC ratio is a clear signal of what has actually happened in this cycle. The ratio peaked near 0.085 in late 2021, when ETH was trading at ~$4,800 and BTC was ~$57,000. Today, with BTC sitting at ~$75,000 and ETH at ~$2,250, the ratio is sitting at ~0.029,only surpassed by the April 2025 lows. This means that ETH has lost about three-quarters of its relative value against BTC over four years. That’s a structural shift in confidence.
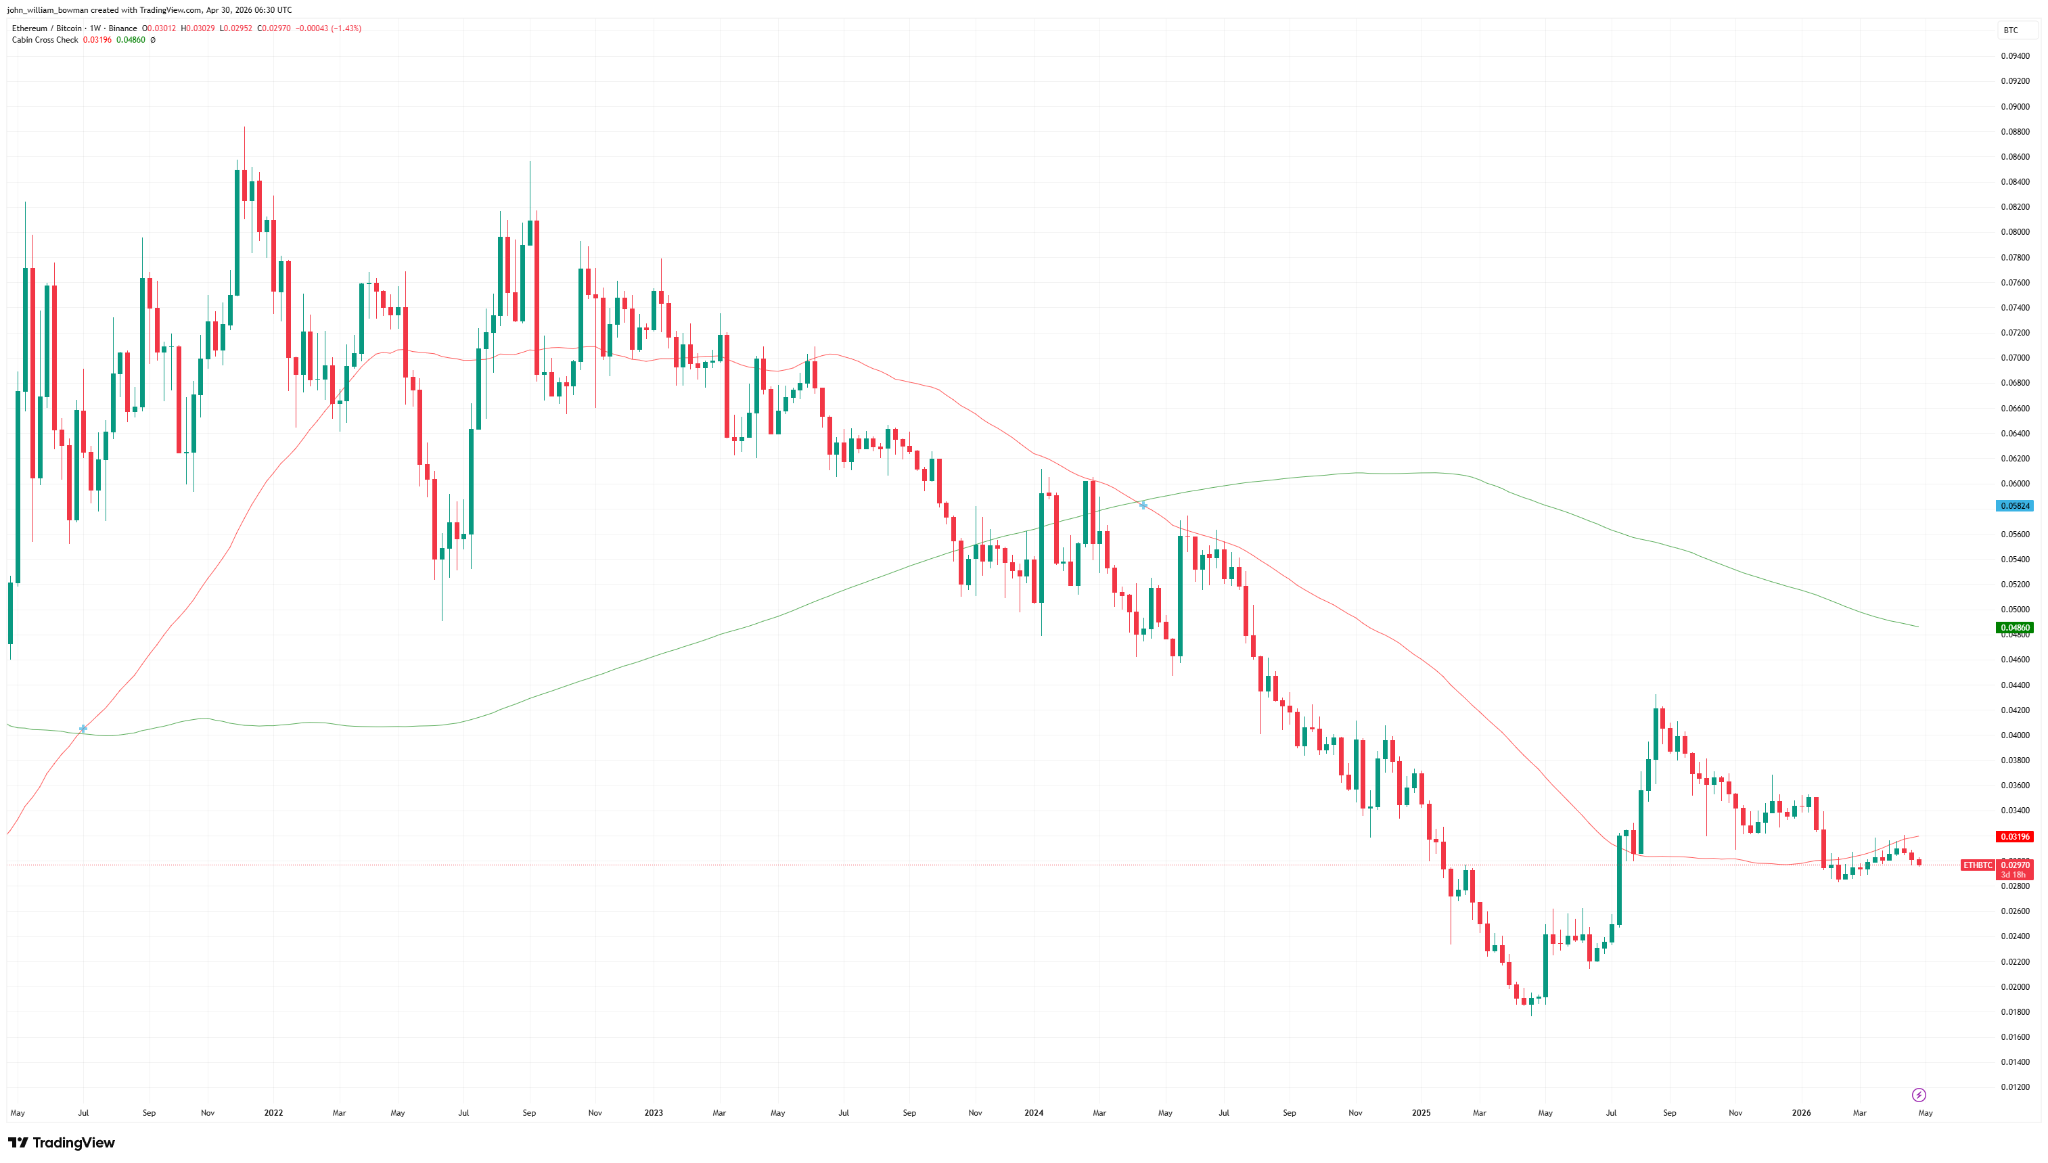
There are real reasons for this divergence, and they aren’t going away anytime soon. Bitcoin has been the asset that institutional capital wanted out of crypto, and the spot ETF approval in early 2024 turned that demand into structural flows that haven’t reversed (although they are a little bearish currently, but the spigot is still on in net). Bitcoin has a single, simple narrative as digital gold, providing scarcity. Ethereum has a more complicated story that is far more technical—smart contracts, DeFi, staking, layer-2 scaling—and complicated stories don’t translate as cleanly to allocator capital.
The spot ETH ETFs that launched in July 2024 have been a relative disappointment compared to the BTC ETF flows, with cumulative inflows running at a fraction of the pace despite ETH having a much more robust ecosystem on paper. The launch of those spot ETH ETFs is where the ETH-BTC ratio really started to slide. They did not help the same way they did BTC.
Sentiment is so poor that from late January onward, shorts have been in control. The funding rate for ETH has been negative for most of the time since, and the positives are dwarfed by the negatives in magnitude. That’s a lot of short pressure.
Ethereum Price Forecast
Every new Ethereum analysis as it publishes, today's technical signal and key levels, live price — on one page.
See all Ethereum forecasts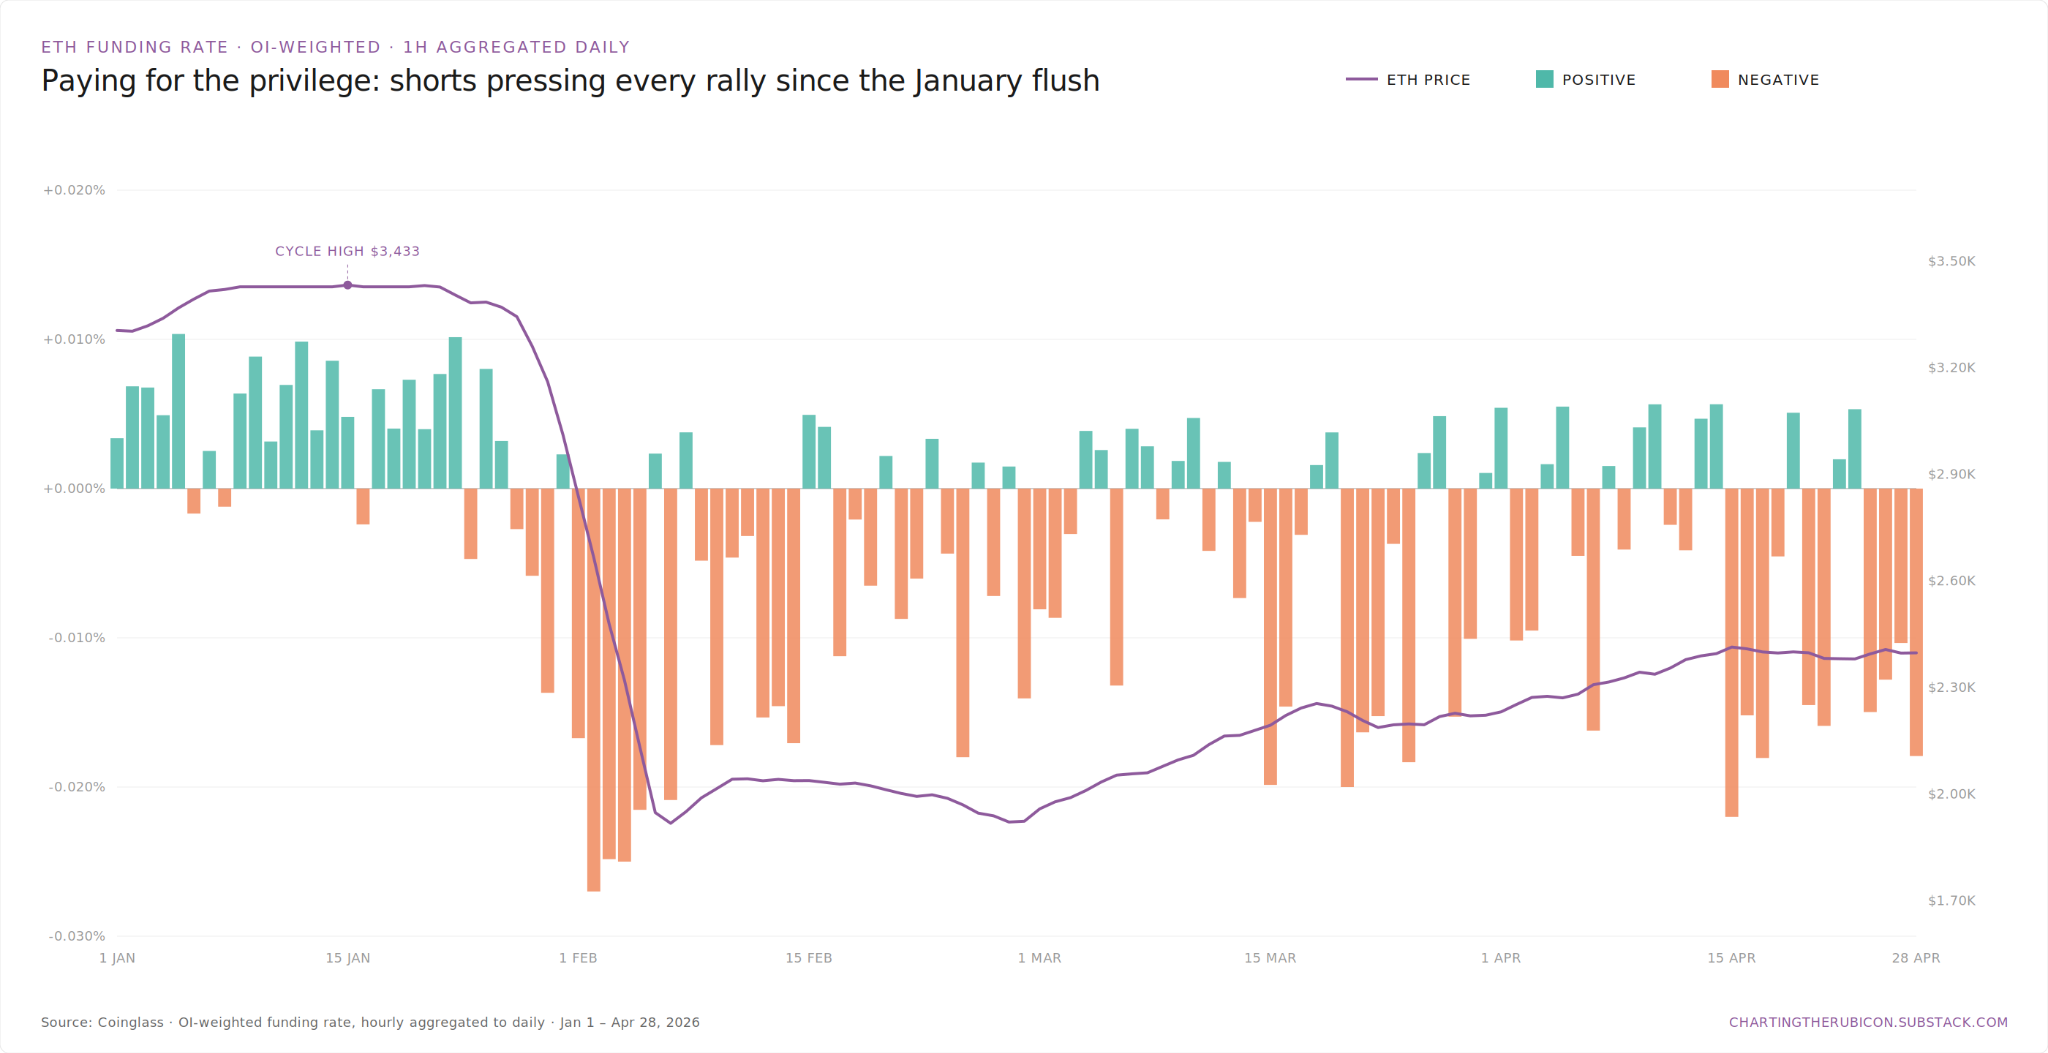
The Staking Yield Is Not What It Was Sold As
One of the cleanest structural cases for ETH was supposed to be the staking yield. After the merge in September 2022 transitioned Ethereum to proof-of-stake, holders could earn yield by locking up their ETH to help secure the network. At the launch of staking, yields were running ~5-6% annualized, and the pitch was straightforward: a tech-adjacent monetary asset that pays you to hold it. That was a compelling investment narrative at the get-go. The reality has been less compelling.
As more ETH has been staked, the yield has compressed to ~3% currently, which is below both short and long-term Treasuries and matches the yield of the Dow Jones Dividend 100. Total ETH staked is now over 38M tokens, which is a massive amount of supply locked up and not contributing to selling pressure—but it also means the marginal staker is earning much less than early adopters did. After accounting for the inflation rate of new ETH issued to stakers, the real yield is closer to ~1-1.5%, which is now competitive with the S&P 500. This has turned out to be less of a catalyst than it was initially sold as.
To the bull’s credit, staked ETH has never been at a higher level, and neither have validator balances (despite the total number of validators falling). Activity is still building, and average block gas usage also recently hit an all-time high while burned fees stay pinned to new lows.
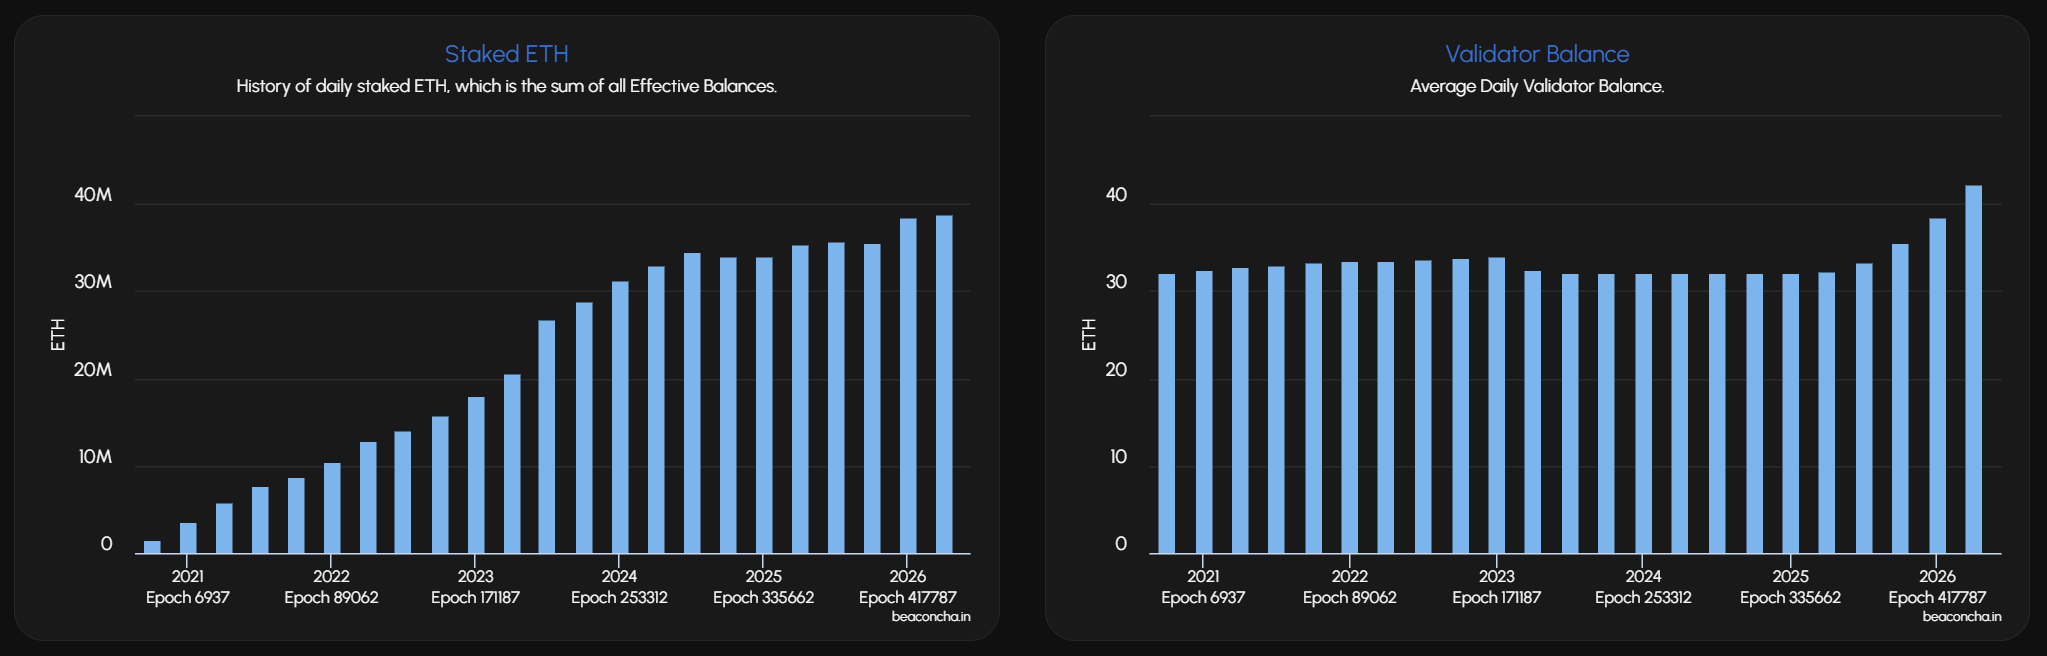
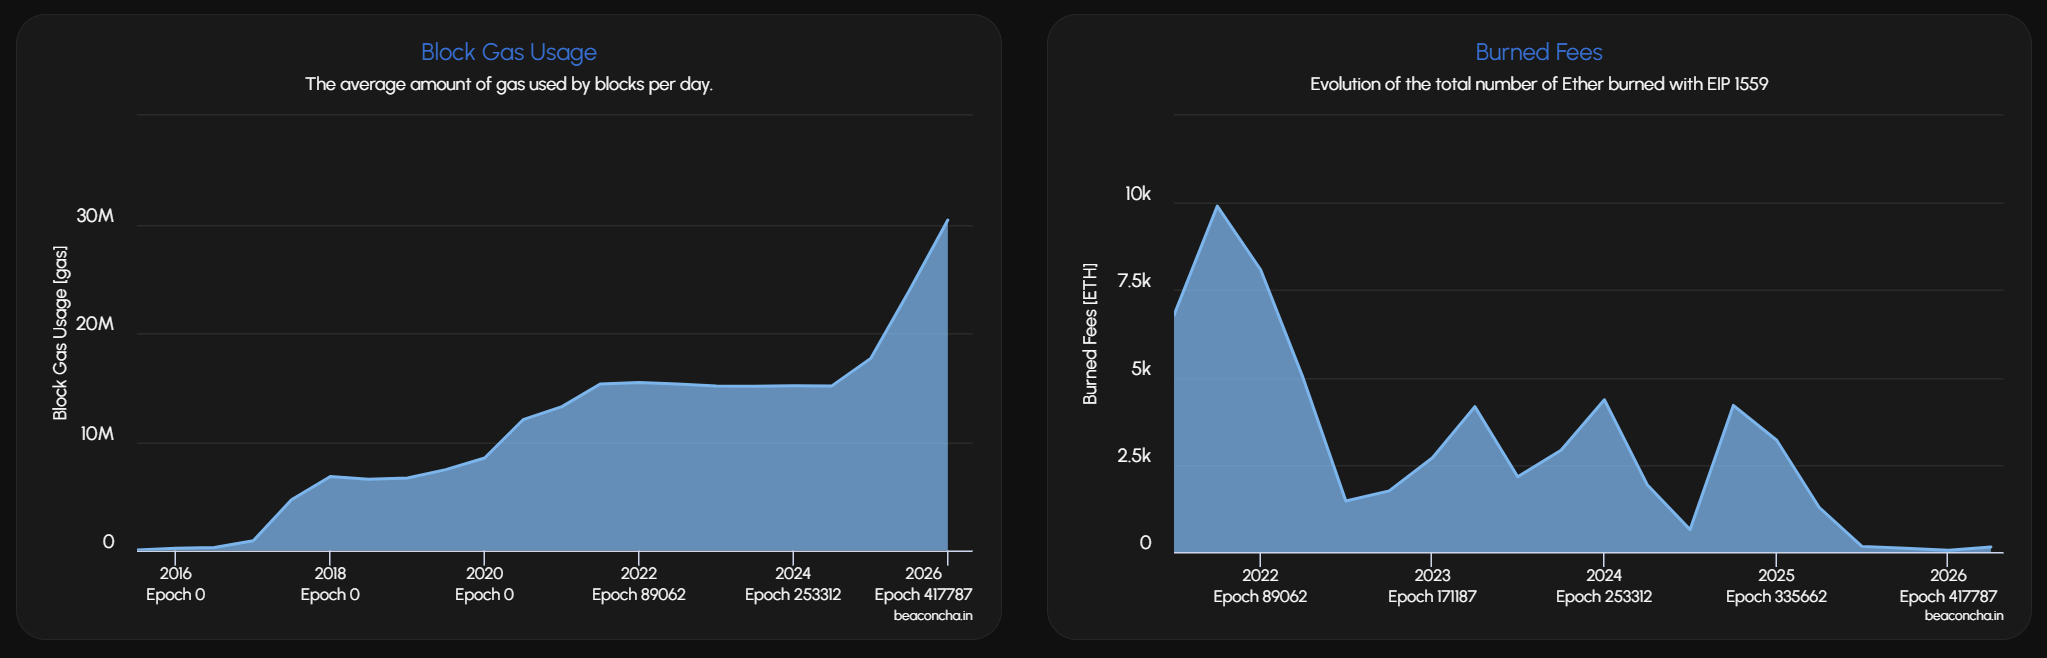
Source: Beaconcha
ETH Technical Outlook
I’m a believer that when it comes to cryptocurrencies, technicals often matter more than fundamentals. Digitally native assets just tend to respect technicals more in my experience, although some traders would call me superstitious.
So we’ll take a look at two charts, because while my usual go-to for the near-time is bearish, a longer timeframe—going out to 5 years—shows ETH in a nicer light, but that means the bulls may need to be patient.
Here’s the ETH 1-year daily chart:
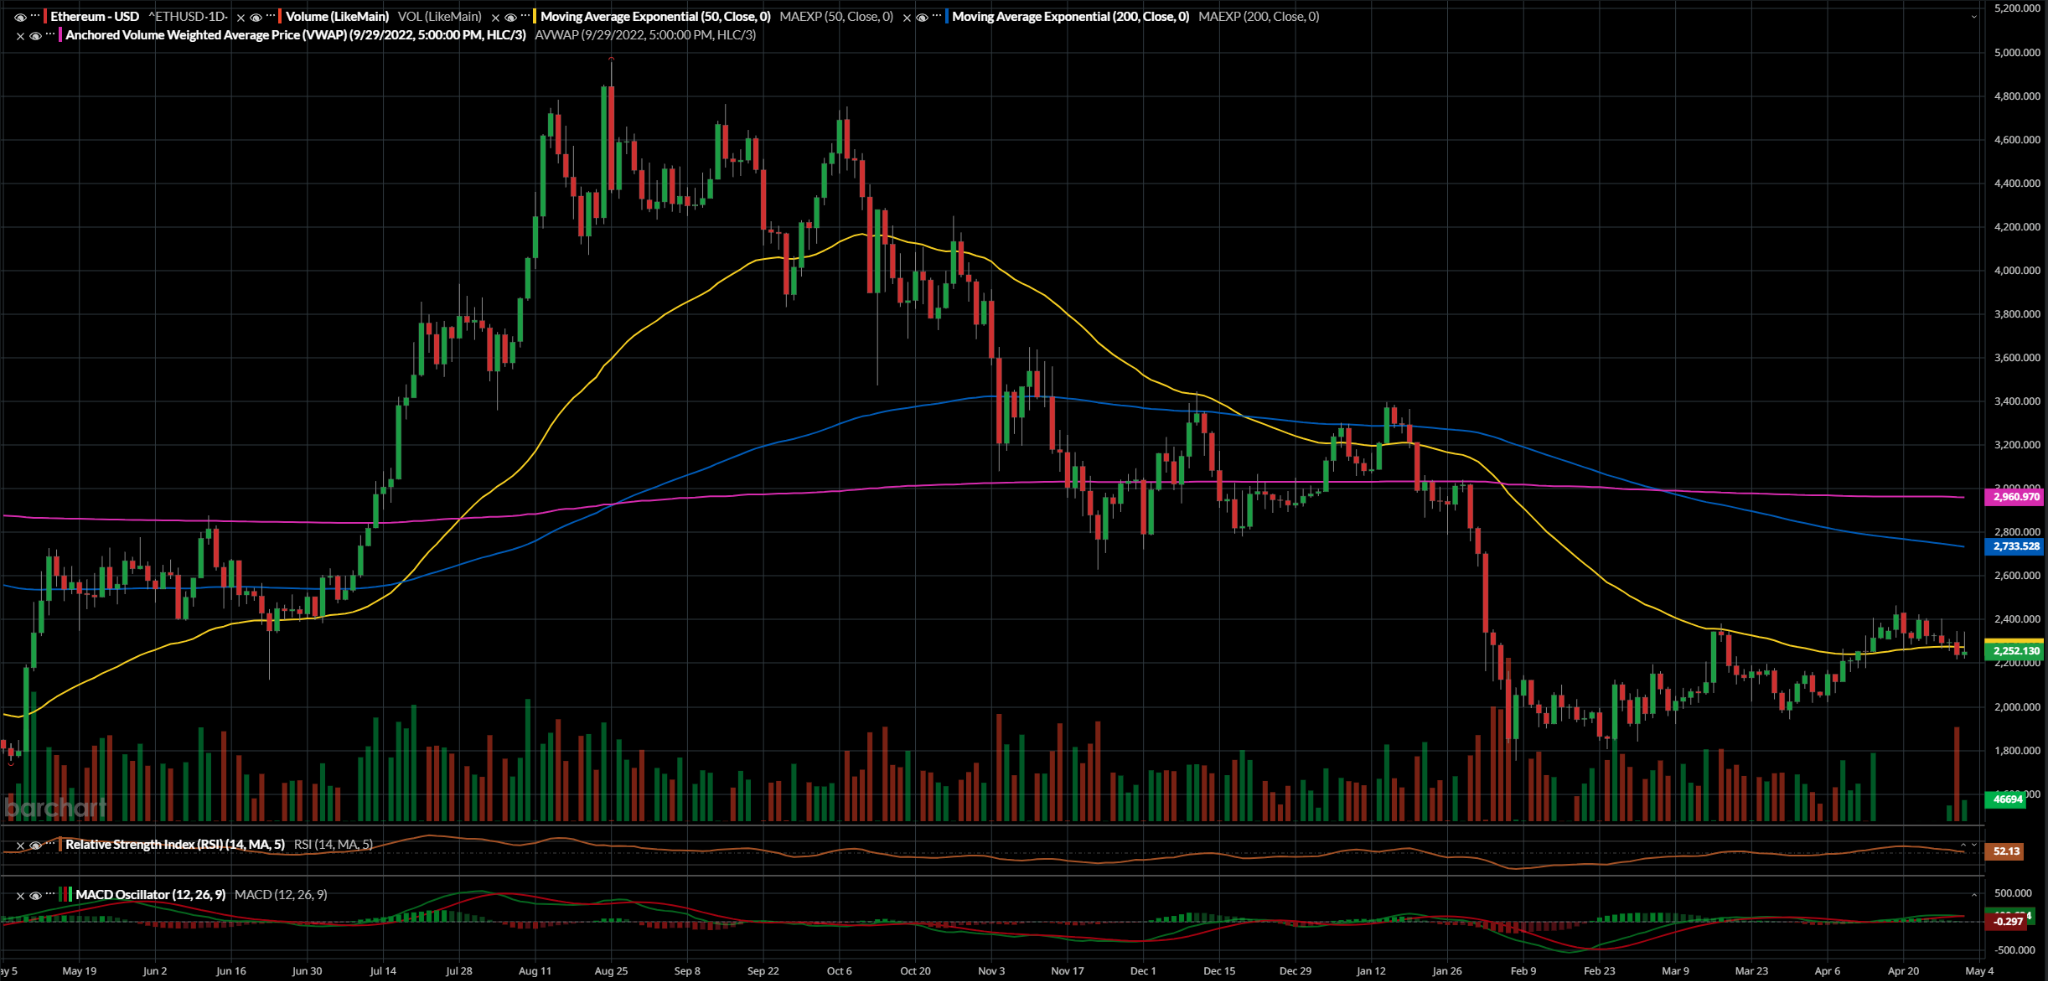
The breakdown below the 50-EMA after the successful breakout in early April is not a good look for ETH, especially as the body of the latest candle fully opened and beneath the line. ~2200 is still the relevant zone, so this single candle isn’t the determinate of ETH’s fate, but it would be validation for a short—especially on the volume that forced it under the day prior—if I were a more aggressive trader.
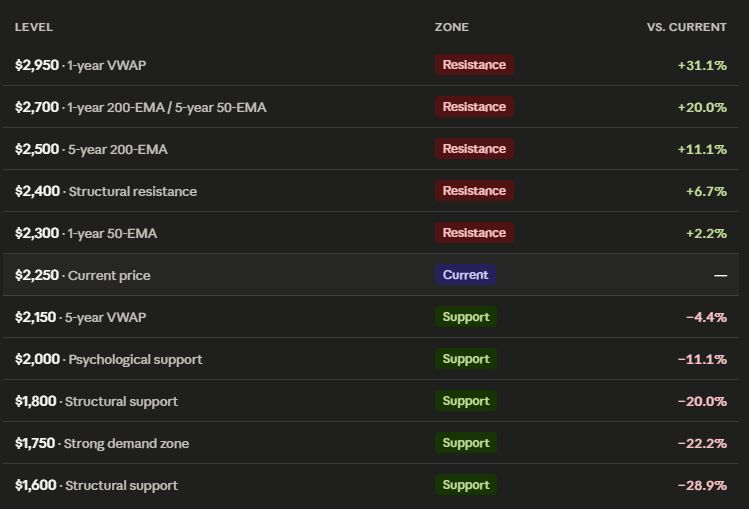
The next support level sits at the psychological ~2,000 zone, and below that ~1,800 is a structural support zone. Should the bulls succeed in holding this general level, the 200-EMA is coming down quickly, currently sitting at the ~2,700 mark, although the recent top of ~2,400 sits as structural resistance before that.
I promised a second chart because the bulls need some love here. Here’s the ETH 5-year weekly chart:
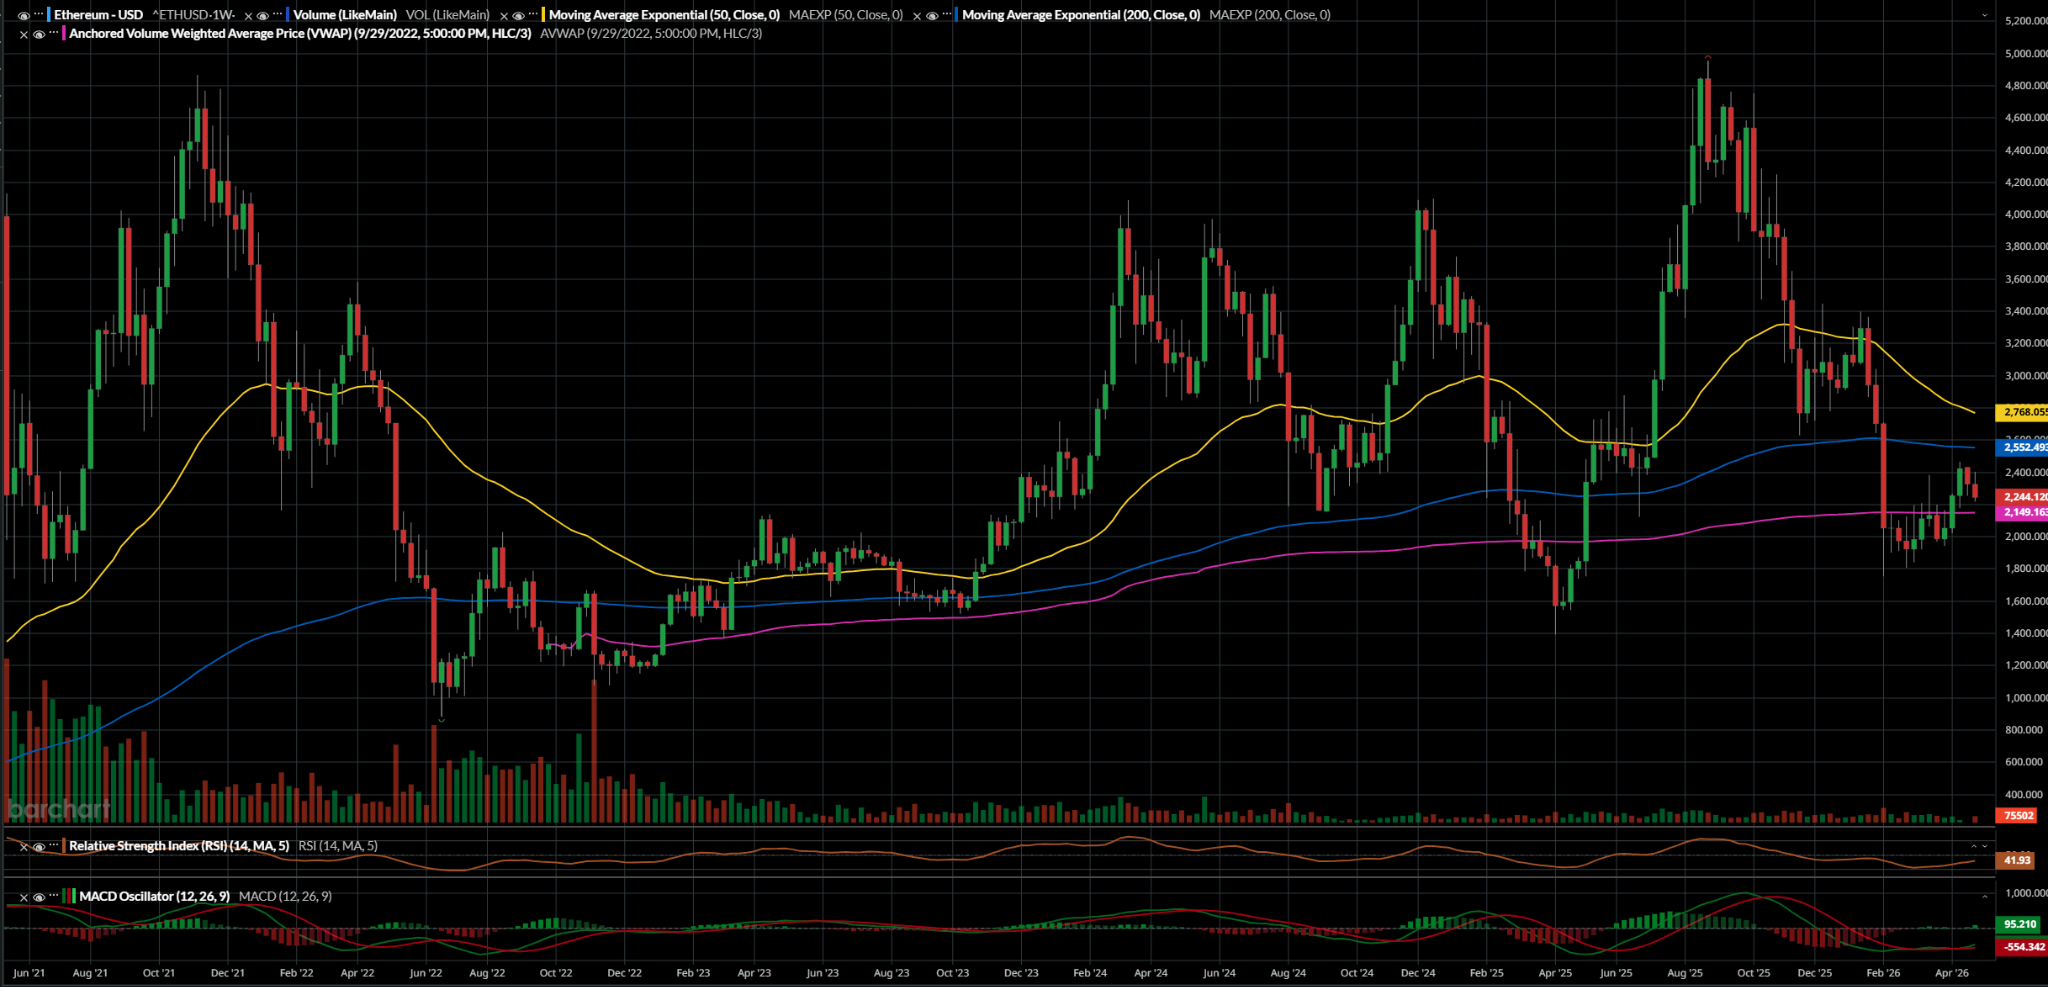
Here, our story is one that the anchored VWAP was just reclaimed after being shunted below it by the candle that was made the week of February 2nd, which moved from above the 200-EMA to below the VWAP, from ~2,750 to ~1,750 wick to wick. But in the following weeks, it’s recovered and reclaimed the VWAP. Now it’s heading back toward it again for a bounce. A successful test of the VWAP will be a very positive sign for the bulls in the medium term, especially for those betting on ETH holding above ~2,000.
There is firm resistance at ~2,500 and ~2,700 from the 200- and 5-EMA respectively, validating the levels in the 1-year chart.
Here are the key levels to watch moving forward:
Conclusion
While I find ETH’s fundamental improvements lacking in their ability to generate investor interest and inflows that could buoy the price, the improvements are technically very impressive. But improvements in technical capacity as a cryptocurrency don’t directly translate to a bullish technical price chart. The breakdown is happening live, and the 50-EMA has officially snapped.
That’s a bearish flag for ETH, and while it could buck its trend, recent catalysts that were expected to generate interest have not brought the capital needed to move ETH back into deeper competition with BTC. So long as the ratio between them widens, and it becomes more clear that large, legacy financial institutions that adopted crypto were most interested in holding BTC and little else from a technological standpoint, I expect ETH to continue to underperform.