


Gold (XAU) and silver (XAG) prices face short term pressure as the market waits for the US inflation report and Federal Reserve Chair Kevin Warsh’s testimony. The spot gold consolidates around the $4,020 level, while silver holds around $57.50 as a stronger U.S. dollar, higher oil prices and Middle East tensions increase market uncertainty. The next move will depend on whether inflation strengthens rate hike expectations or gives both metals room to rebound from key support.
US Inflation and Middle East Risks Keep Metals Under Pressure
Gold prices rebounded slightly on Tuesday before the US inflation data, but they remain under pressure. Traders are adjusting their positions before the release of US CPI data and Federal Reserve Chair Kevin Warsh’s testimony. The gold price consolidates around $4,020, while the spot silver price consolidates around $57.50.
The U.S. CPI will likely be the main driver of the gold and silver prices. The stronger-than-expected inflation data will increase the expectations of a September rate hike. These expectations will push the US Treasury yields and the US dollar higher and would put further pressure on the precious metals. But the soft inflation data may reduce the rate hike expectations and spark a rebound in gold and silver prices.
Middle East tensions are adding another layer of uncertainty in the financial market. The United States carried out new strikes on Iranian military targets. Iranian forces also hit tankers in the vicinity of the Strait of Hormuz. These developments have raised concerns about escalation of the conflict and potential disruptions in global energy supplies. The conditions favor demand for gold as a safe haven, but also have driven up oil prices.
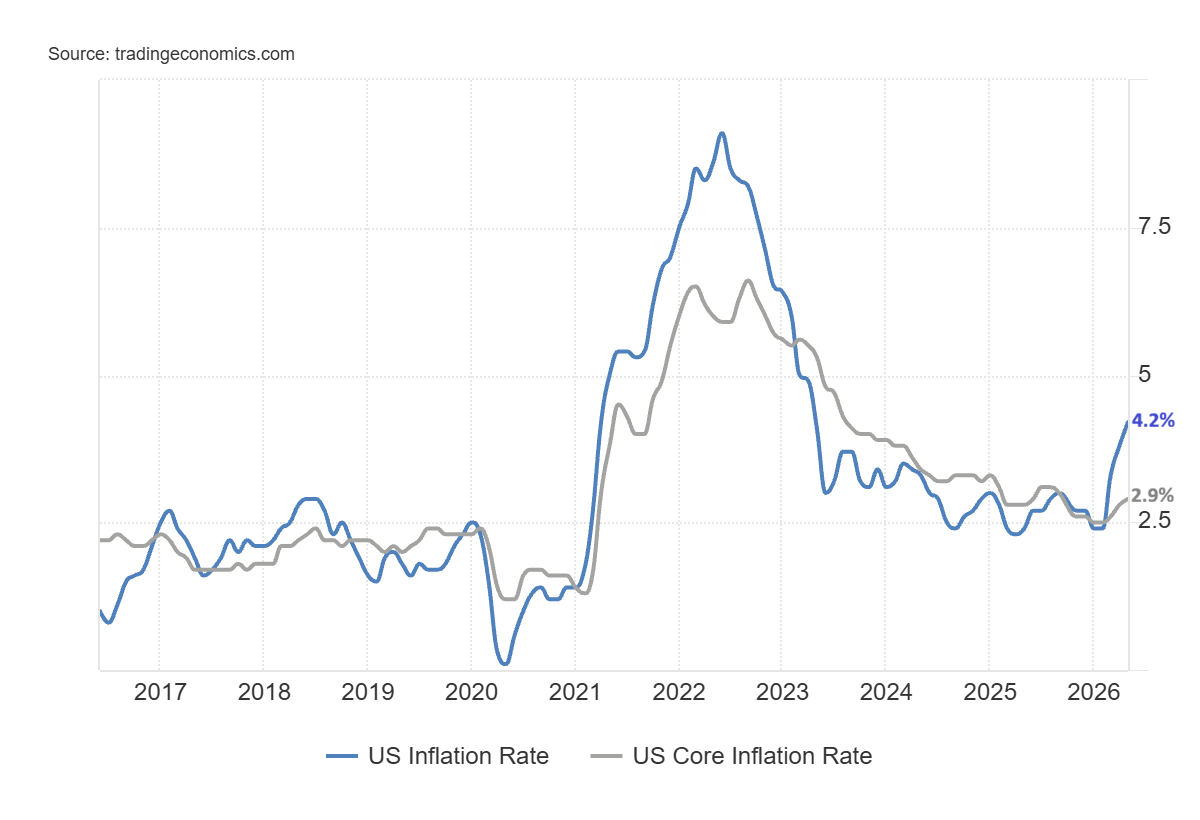
The higher oil prices raise the transportation and production costs. This could lead to higher inflation for longer. This situation would further keep the inflation above the Fed’s 2% target. The chart below shows that US inflation is currently at 4.2% and increasing after the US-Iran war. On the other hand, the core inflation is at 2.9%. The market expects US inflation to be 3.8% and core inflation to be 2.8% in June. A higher-than-expected inflation reading will likely raise expectations of higher interest rates from the Fed.
Gold also sees some support after the EU announcement of new Sudan gold sanctions. The sanctions could affect flows of gold in the region and exacerbate supply concerns. But the most significant catalysts are the inflation report in the U.S. and Warsh’s remarks.
Gold Price Forecast
Every new Gold analysis as it publishes, today's technical signal and key levels, live price — on one page.
See all Gold forecastsUS Dollar Strengthens Ahead of Inflation Data
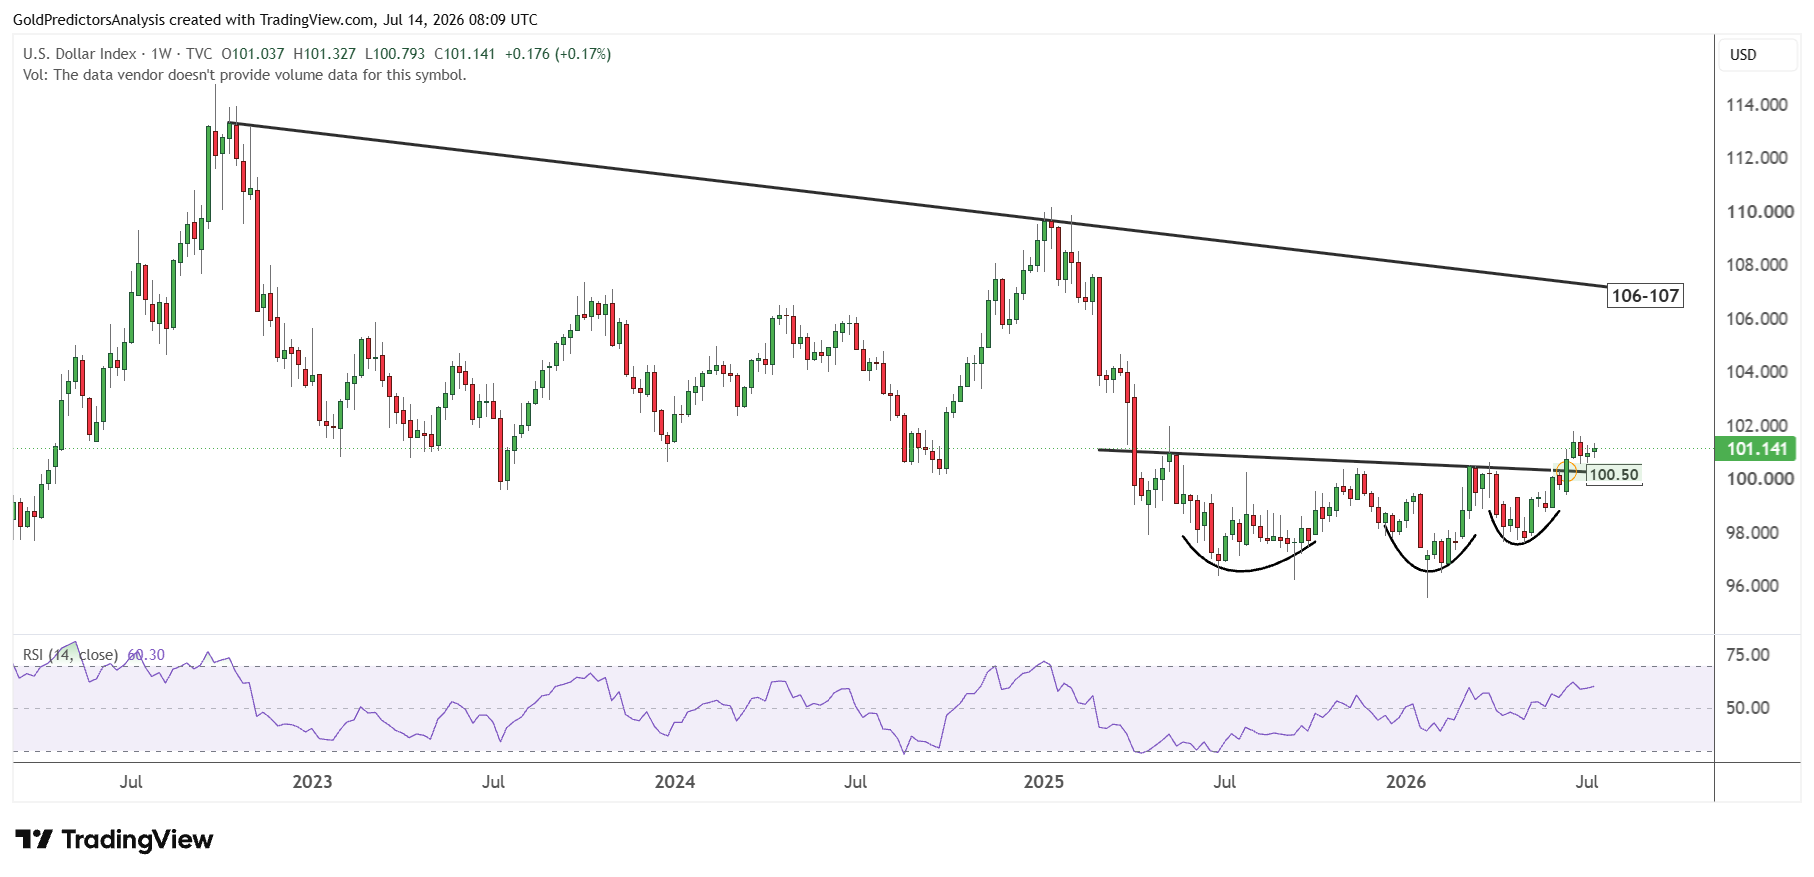
The weekly chart for the USD Index shows that the index has broken above the 100.50 level, which is the neckline of the bottom formation process. This breakout indicates that the USD will likely remain stronger in the short term and target the 104 level.
However, a break above the 104 level will likely trigger another move towards the 106-107 zone, which is the resistance marked by the descending trendline from the October 2022 highs. On the other hand, if the USD Index breaks below the 100 level, it will likely trigger another drop towards the 97 level.
The RSI remains above the midline and looks constructive towards higher levels. A breakout above the 100 level indicates that the positive momentum may persist.
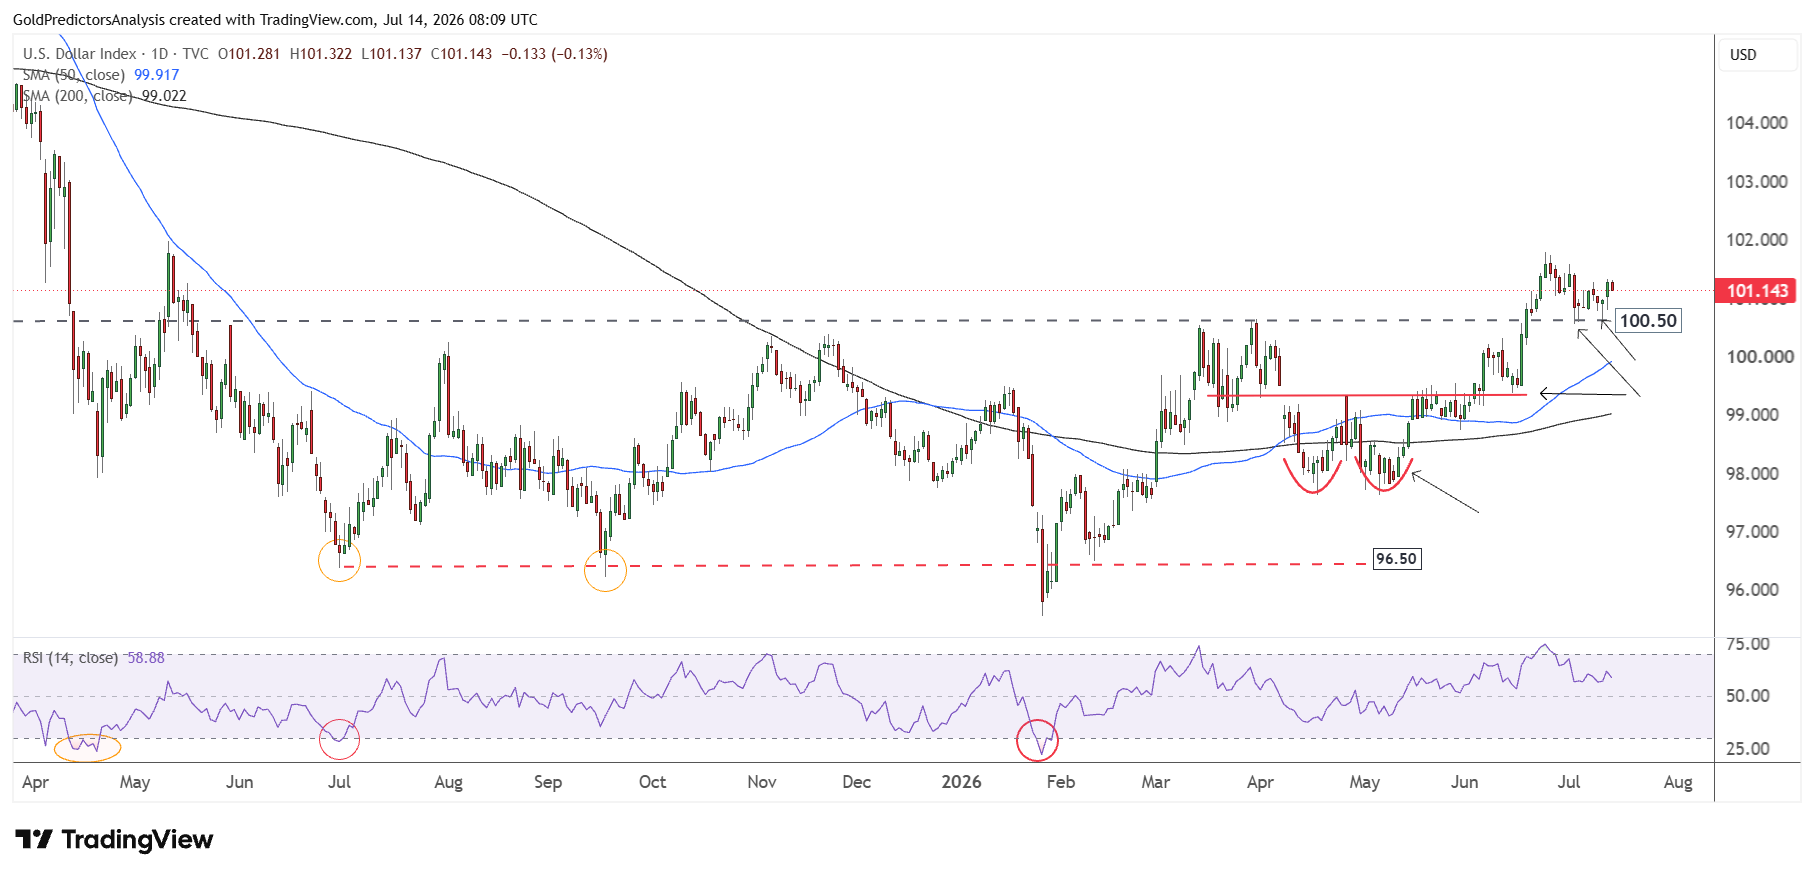
The positive price action in the USD Index is also visible on the daily chart. The daily chart shows that the index has been consolidating in a tight range between the 96 and 100.50 levels since June 2025. The index formed a double bottom pattern in April and May 2026. This pattern broke at the 99.50 level to initiate a move higher.
This bullish price pattern also broke the key 100.50 level and triggered positive momentum. The formation of a bullish hammer candle on July 10, 2026, indicates that the index may remain stronger in the short term. A break above 101.70 will likely trigger another rally towards 103.50.
Based on the above analysis, if the inflation data is stronger than expected, it will trigger a strong rally in US dollar index.
Gold and Silver Long-Term Structure Remains Bullish
Gold and silver prices remain constructive in the long term, but prices are correcting back towards their respective support zones in 2026. The long term outlook for both metals shows that prices broke key resistance levels for the first time in 2025. Gold prices broke above $2,800, while silver prices broke above the $50 area and closed above these levels for the first time in history. These breakouts suggest that gold and silver prices may continue to rally in subsequent years.
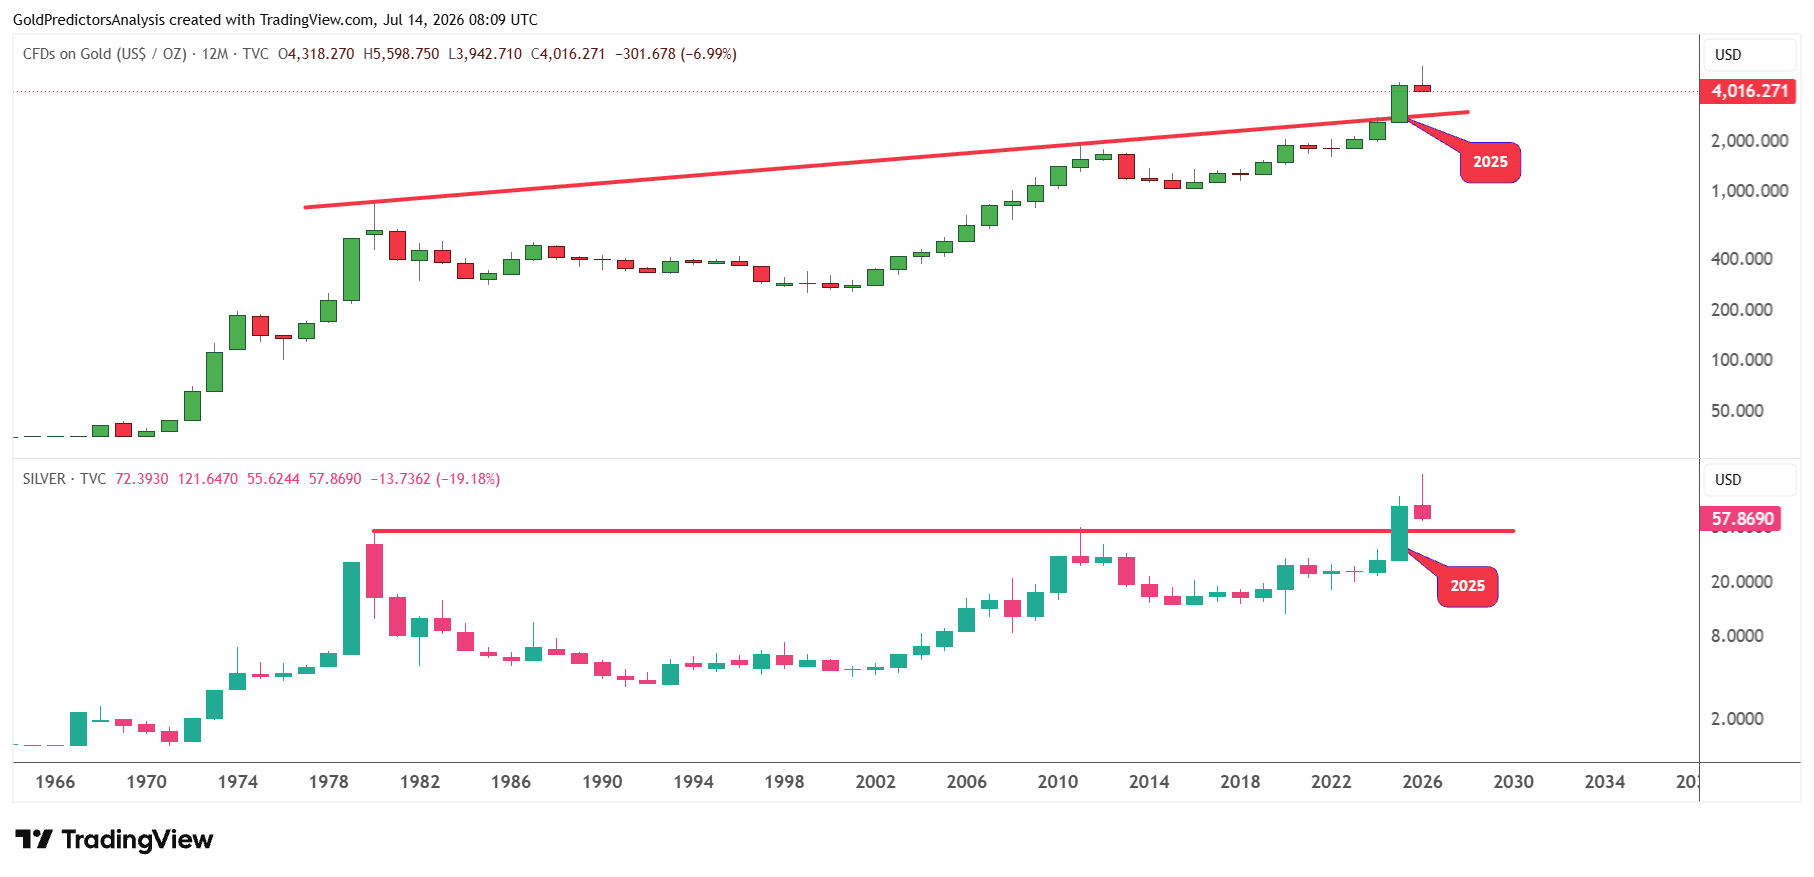
But gold and silver prices must hold above $2,800 and $50, respectively, in 2026 to protect this bullish momentum in both metals. If gold closes below $2,800 in 2026 and silver closes below $50, it will likely indicate that the breakouts were false and may trigger a strong correction in the subsequent quarters.
However, the bullish formations in silver and gold prices since the 1980s indicate that prices will likely rally. This rally will likely be driven by strong bullish structures and central bank demand.
Gold and Silver Test Key Support Before US Inflation Data
Despite the strong long-term bullish momentum, the short-term price action for both metals appears compressed around current levels. Prices have been dropping since the March 2026 highs as oil prices continued to surge after the U.S.-Iran war. However, prices have formed compression patterns during the past four weeks and continue to test key support.
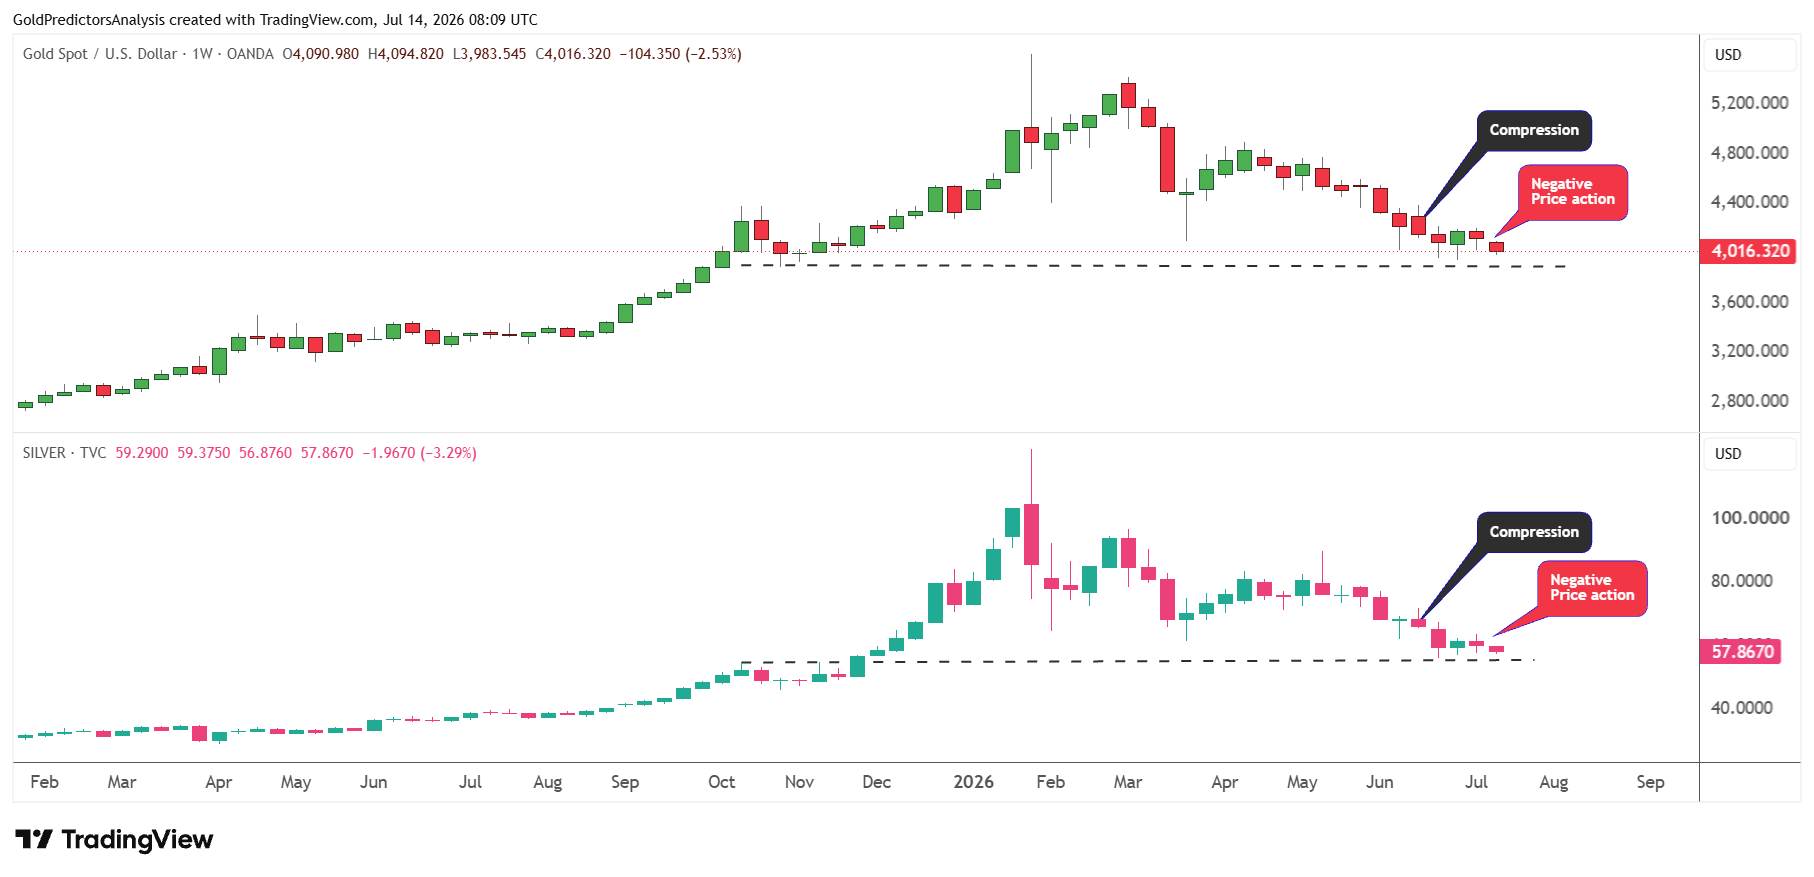
The key support line for spot gold is at $3,950. In spot silver, it lies around $55. A break below these levels will likely initiate the final drop in both metals before a key reversal. Higher inflation data, the unresolved U.S.-Iran crisis and higher interest rate expectations are putting pressure on prices in the short term.
However, these higher inflation readings will likely support gold and silver prices in the long term. Therefore, investors may consider buying at lower levels in both metals before the next surge.
The chart below provides a clearer view of how gold and silver prices have remained strong and continued to rise to new record highs due to geopolitical uncertainty. However, the real drop in both metals appeared after the U.S.-Iran war.
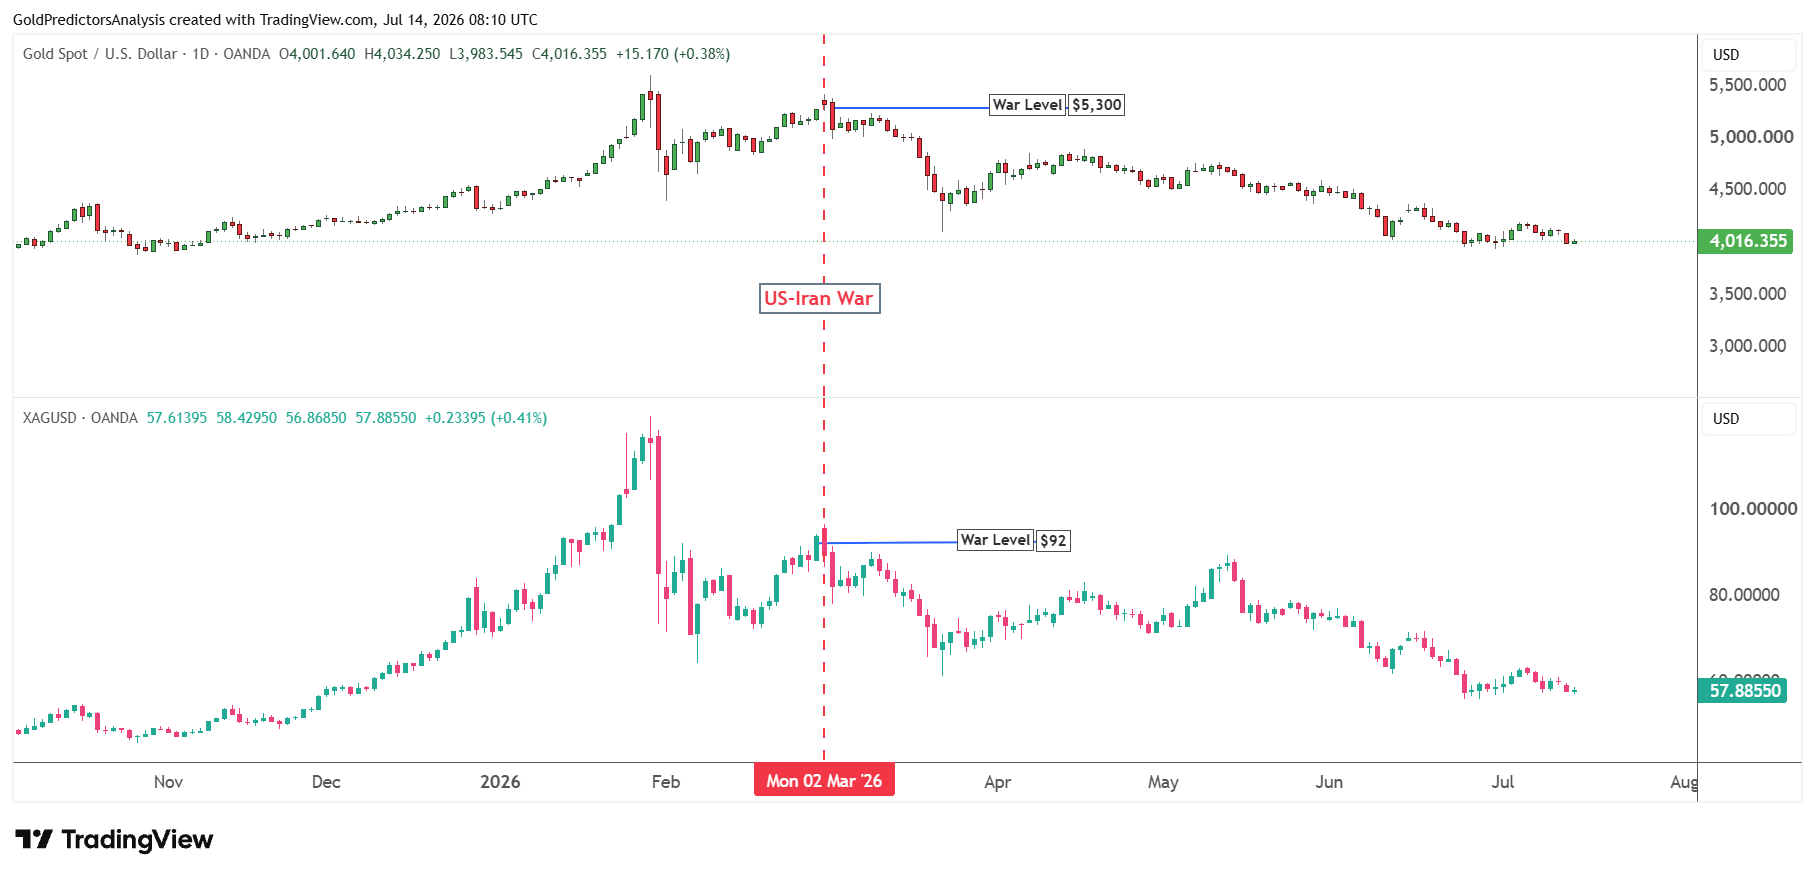
Prices continued to drop from the pre-war levels of $5,300 in gold and $92 in silver. Gold and silver prices now remain well below their pre-war levels and continue to consolidate as they search for the next move. The recent price action around the current zones indicates that the market is waiting for clearer data to define the next move.
However, as long as the U.S.-Iran conflict remains unresolved and inflation continues to move higher, gold and silver prices will likely remain under pressure. The inflation will likely remain high as the real impact of higher oil prices in April and May will likely be seen for a longer time.
Gold-to-Silver Ratio Signals Further Near-Term Weakness
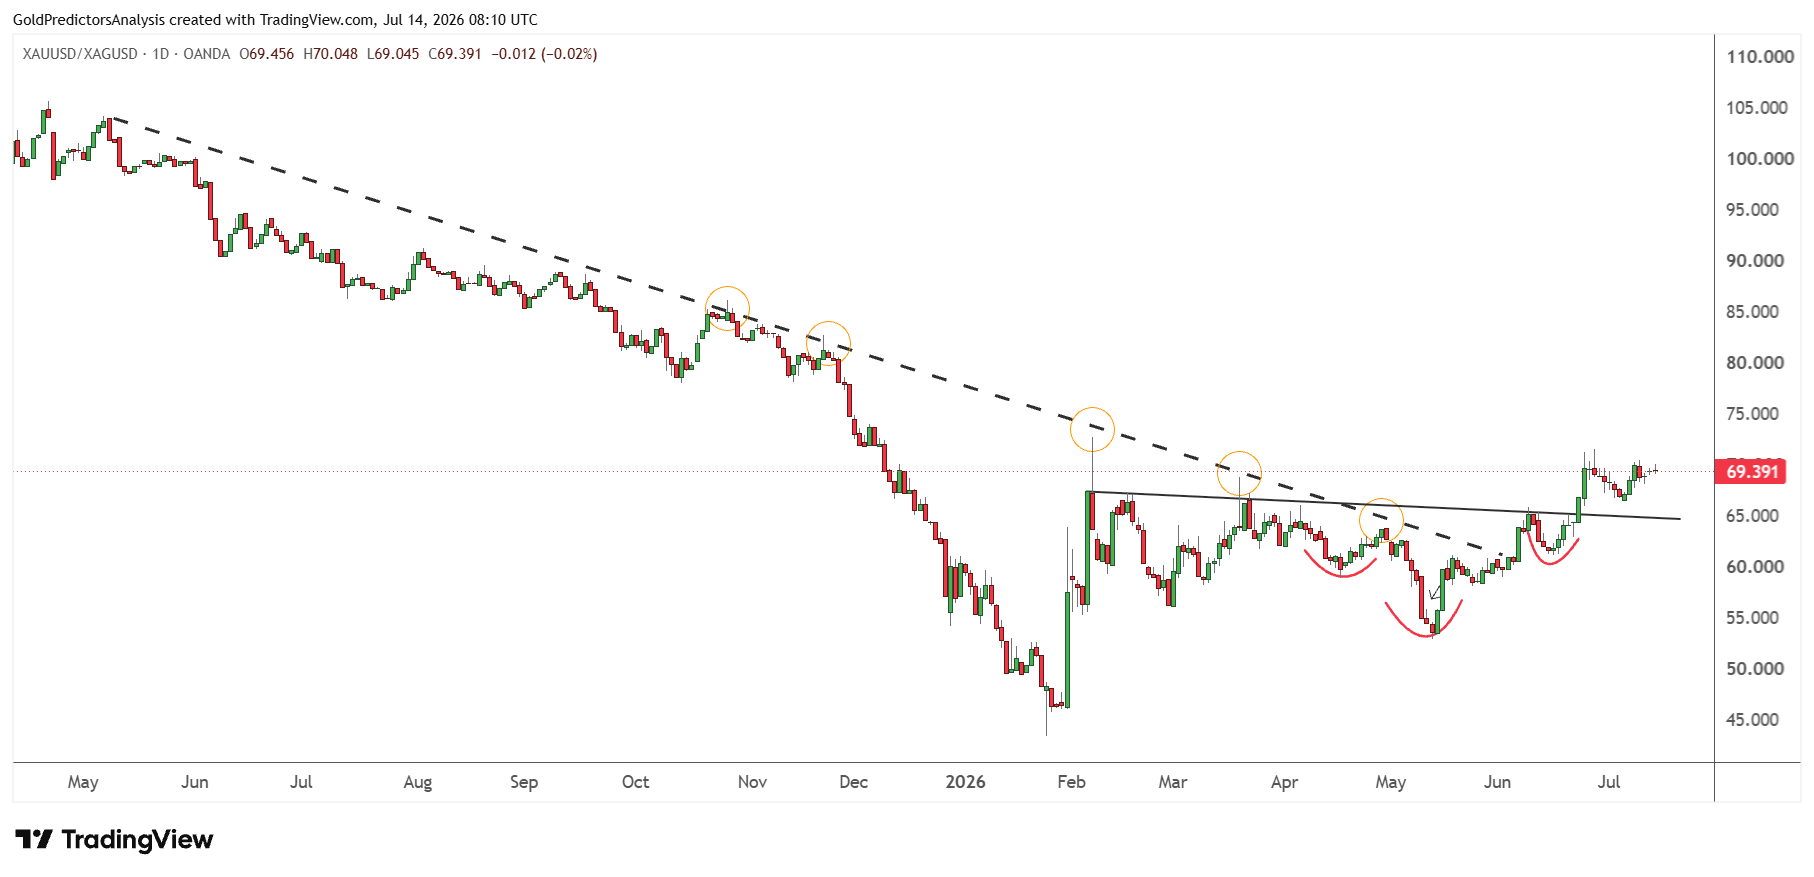
The chart below shows that the gold to silver ratio has rebounded from its January 2026 lows and broken above 64. This breakout is pushing the ratio to 70. Historically, silver outperforms gold during the precious metals bull markets. Therefore, each peak in the gold to silver ratio forms major bottom in both metals. When the ratio produces a bottom, it forms a strong top in both metals.
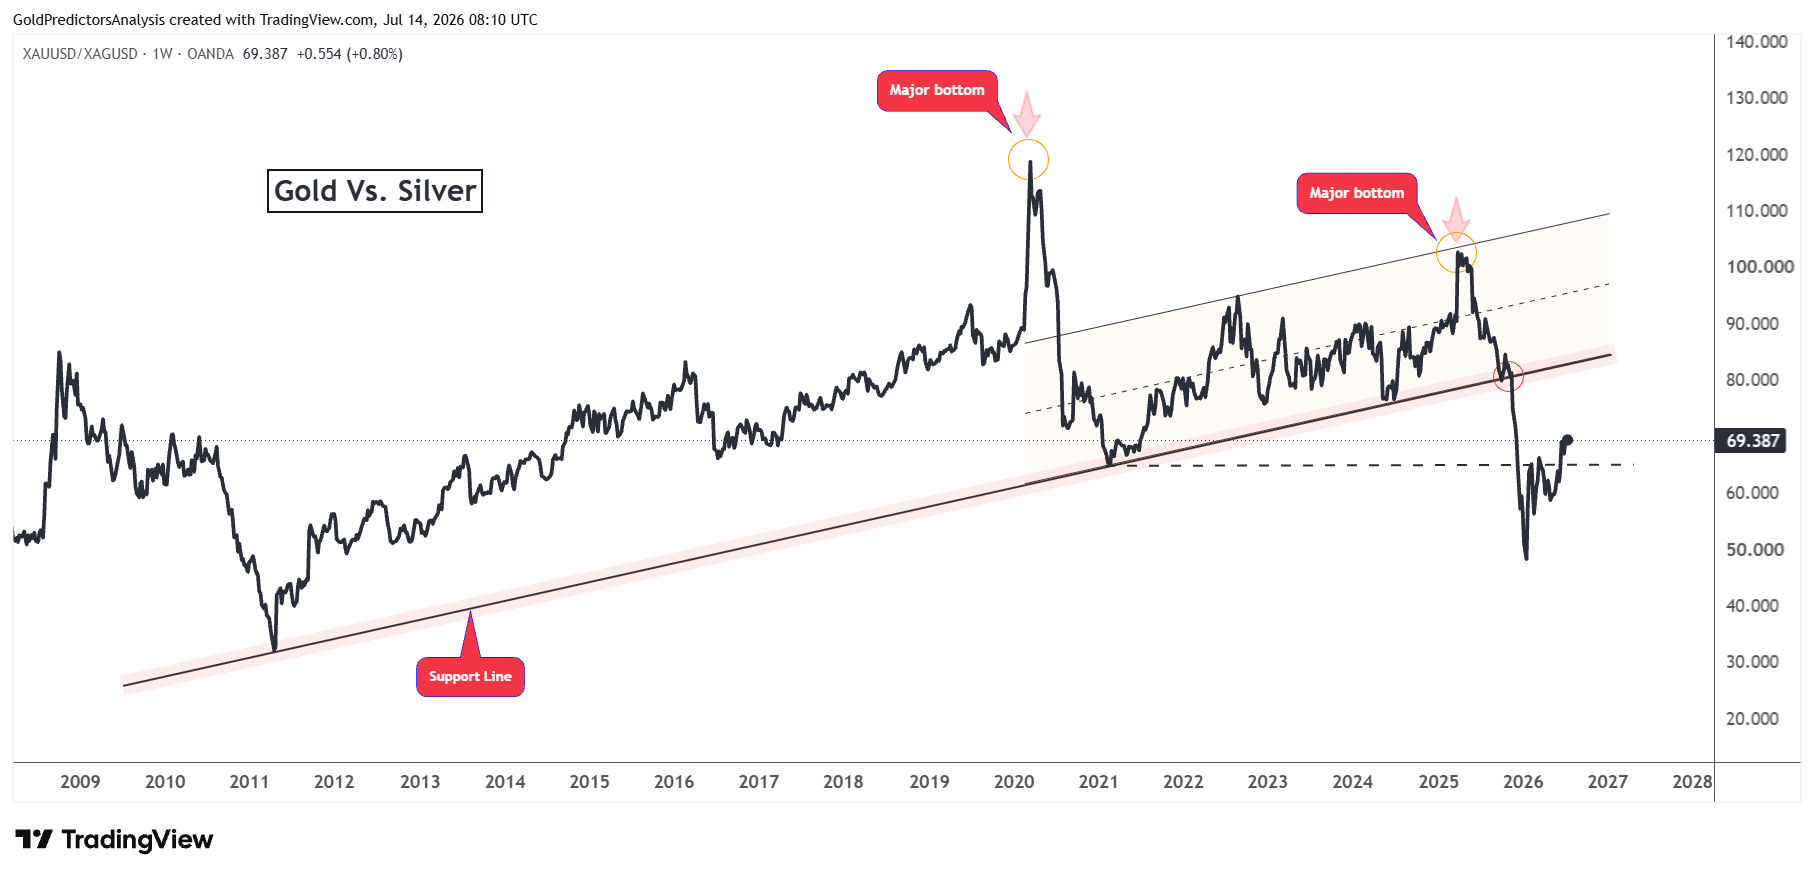
One clear example is observed in March 2020 and March 2025. Gold and silver prices produced strong bottoms and continued to rally. During this time, the gold to silver ratio reached a peak and continued to drop.
Now, the gold to silver ratio has formed a bottom in January 2026, when gold and silver produced a top at $5,620 and $92, respectively. The rebound in the ratio above the 64 level indicates that gold and silver prices may remain under pressure until the ratio peaks and begins to drop again.
The short-term price action of the gold-to-silver ratio shows that it has broken above the descending trendline stretching from the May 2025 highs. This breakout in the ratio indicates positive momentum in the short term. It also indicates that further pressure on gold and silver prices may continue in the short term.
Bottom Line
Gold and silver prices may remain under pressure in the short term as inflation risks, higher oil prices and a stronger U.S. dollar support higher interest rate expectations. The U.S. inflation report and Kevin Warsh’s testimony will likely define the next move in metals. A stronger inflation reading may push gold below $3,950 and silver below $55 before a reversal. Softer data may weaken the dollar and support rebound in both metals.
The long term outlook remains constructive as long as gold remains above $2,800 and silver stays above $50. The current weakness appears to be part of broader correction rather than the end of the bullish trend. But the rising gold to silver ratio suggests that more short-term weakness is still possible. A peak in the ratio, followed by a reversal to lower levels, may provide a stronger signal that gold and silver are ready for the next major rally.
read more: Oil Surge Tests Key Support in Gold and Silver Ahead of US CPI