



Gold (XAU) prices have been in a tight range as the loose financial conditions, sticky inflation and Middle East tensions continue to influence market sentiments. The metal closed nearly on the rising trend line last week, which keeps the larger bullish pattern alive despite the pressure from rising Treasury yields. I think this setup keeps gold in a better position to make a bigger move once the current consolidation period is over. This article highlights the key macro drivers, technical and market risks that can determine whether gold will break above $5,000 or the market will retest at a deeper level first.
Gold Macro Drivers: Liquidity, Yields, and Inflation Risk
Loose Financial Conditions Support Gold as Treasury Yields Cap Upside
The financial situation is becoming supportive again. The Chicago Fed National Financial Conditions Index has dropped to -0.518. This stage demonstrates that the monetary situation is loose. That is important to gold since easier liquidity tends to favour nominal assets. It also minimizes stress in all markets and encourages investors to have assets other than cash.
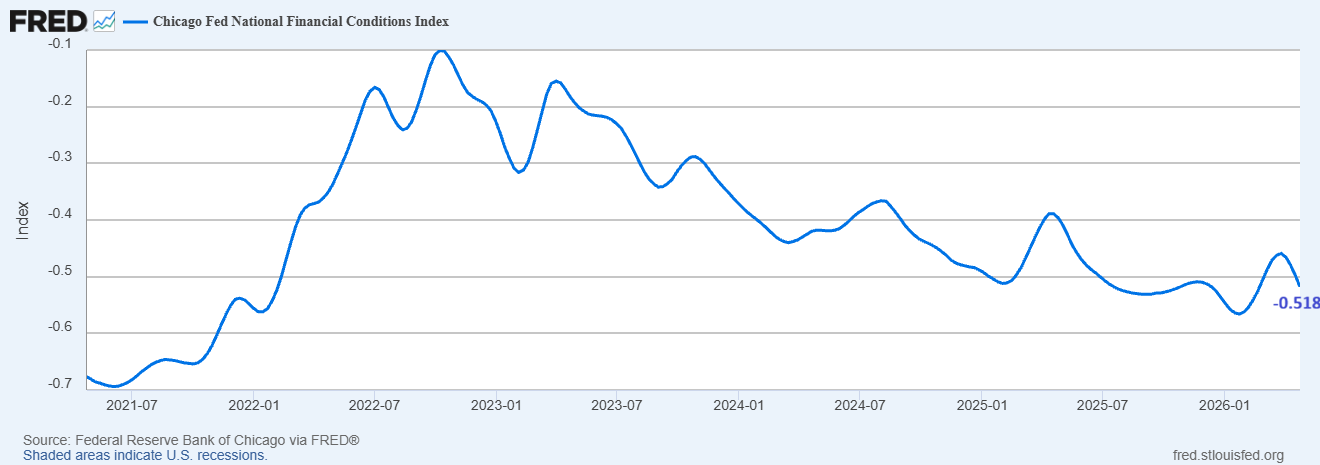
The fact that Bitcoin (BTC) has now moved above the 70K support level confirms this change in risk appetite. Investors can no longer conceal themselves solely in defensive investments. They are also introducing risk market exposure. This sends mixed signal for gold. On the one hand, a higher liquidity supports gold as more money can be directed towards hard assets. On the other hand, a higher risk appetite would decrease the short-term safe haven demand.
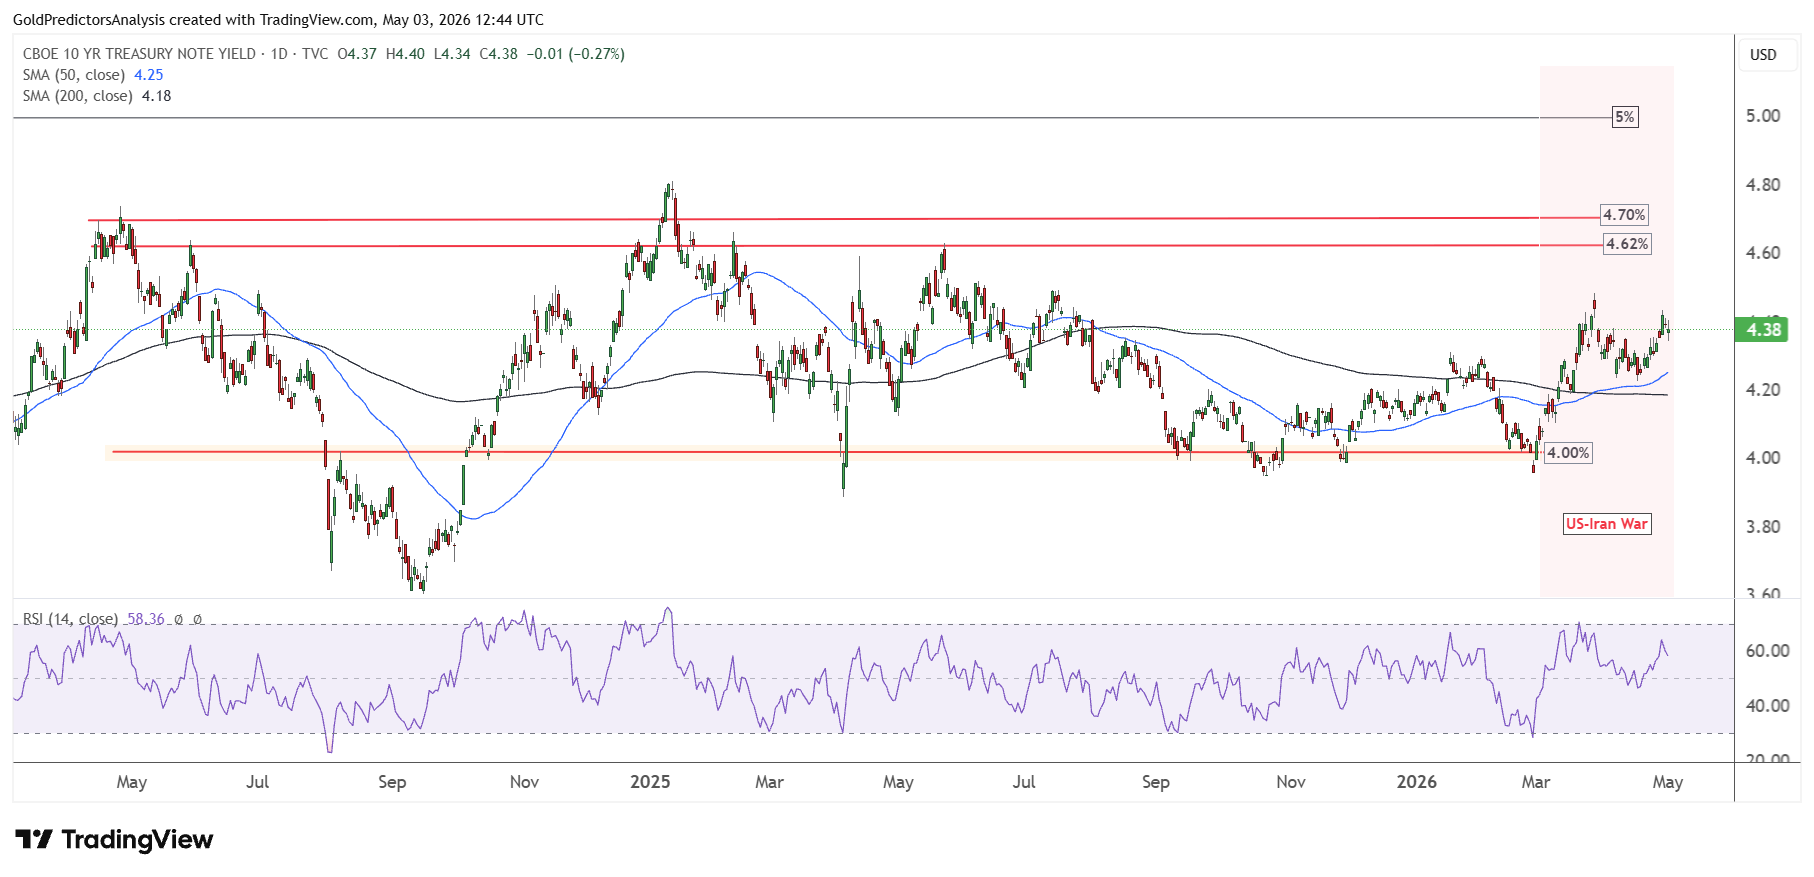
Nonetheless, the primary obstacle is Treasury yields. The 10-year yield is also testing the waters at 4.4%. The increase in long term yields also has the potential to strain gold as the long term yields can increase the opportunity cost of holding a non-yielding asset. This implies that gold might not be able to push higher in a straight line. The stronger setup would come if liquidity remains loose and yields do not rise above resistance. The combination would indicate a clean bullish environment for gold.
Gold Price Forecast
Every new Gold analysis as it publishes, today's technical signal and key levels, live price — on one page.
See all Gold forecastsWeak Consumer Confidence and Rising Input Costs Boost Gold Demand
The confidence of consumers is weak. The chart below shows that the consumer confidence index of the Conference Board stands below 100. The index dropped to 92.8 in April. This level indicates that households are still conservative. The small increase in March does not alter the greater view. Consumers continue to be concerned about business conditions, labour conditions and higher gasoline prices.
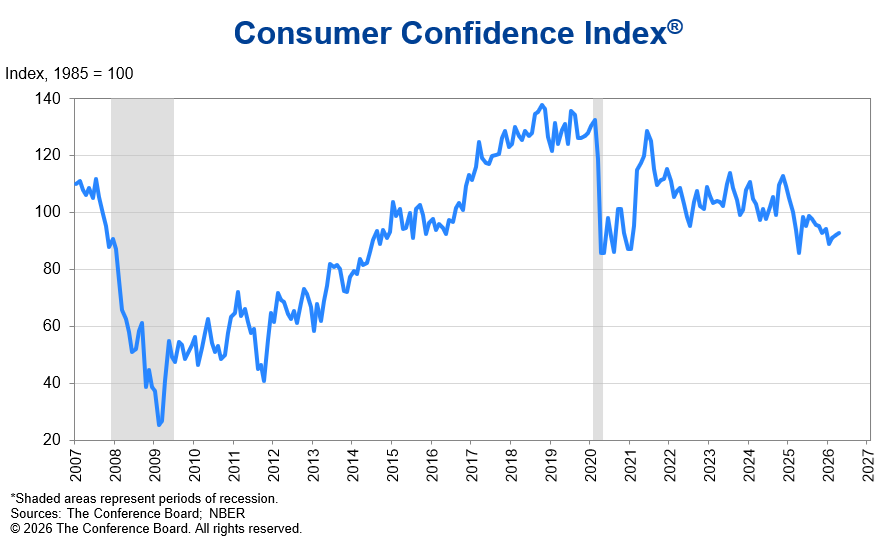
This matters to gold as low confidence will slow spending. Meanwhile, inflation will likely be boosted with increased energy costs. That combination forms the backdrop of stagflation. This is not yet entirely bearish on the economy, but it puts strain on households and businesses. Gold can be more positive in cases where investors fear that inflation will persist with the lower growth rate.
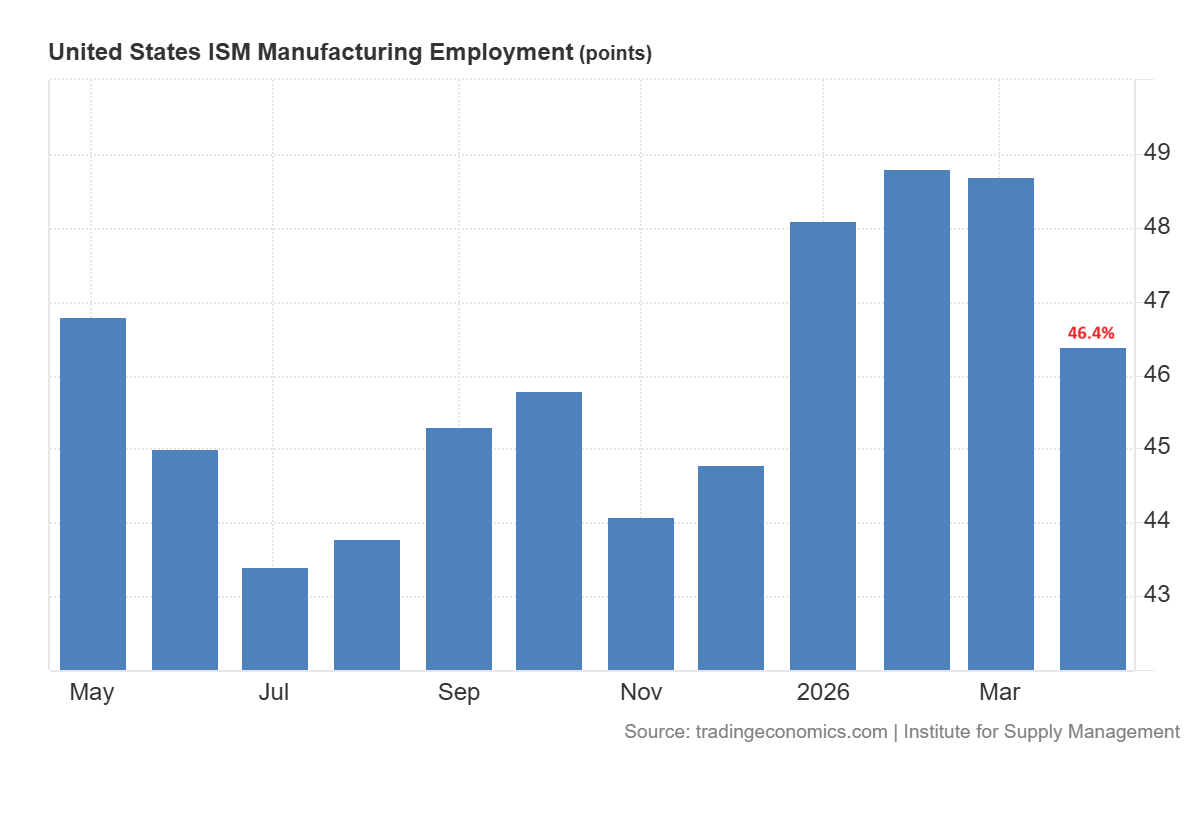
Another layer to this perspective is the ISM Manufacturing PMI. The chart below shows that the ISM Manufacturing PMI was 52.7% which indicates growth.
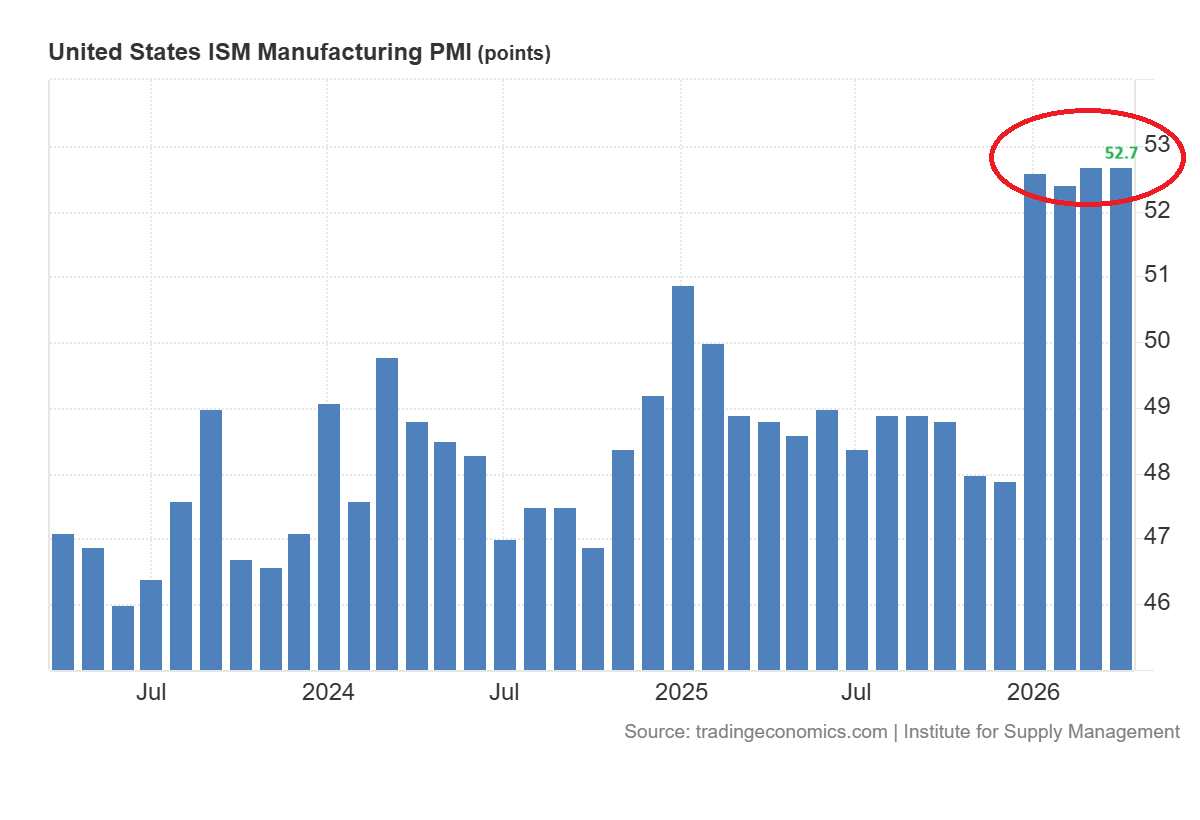
However, the manufacturing employment index declined to 46.4%. This implies that factories are continuing to lay off workers. This results in a split signal. The manufacturing activity is getting better, yet the labour aspect is still soft. This uncertainty supports the gold price as it is more difficult for Fed to respond.
Oil Price Shock Keeps Inflation Pressure High for Gold
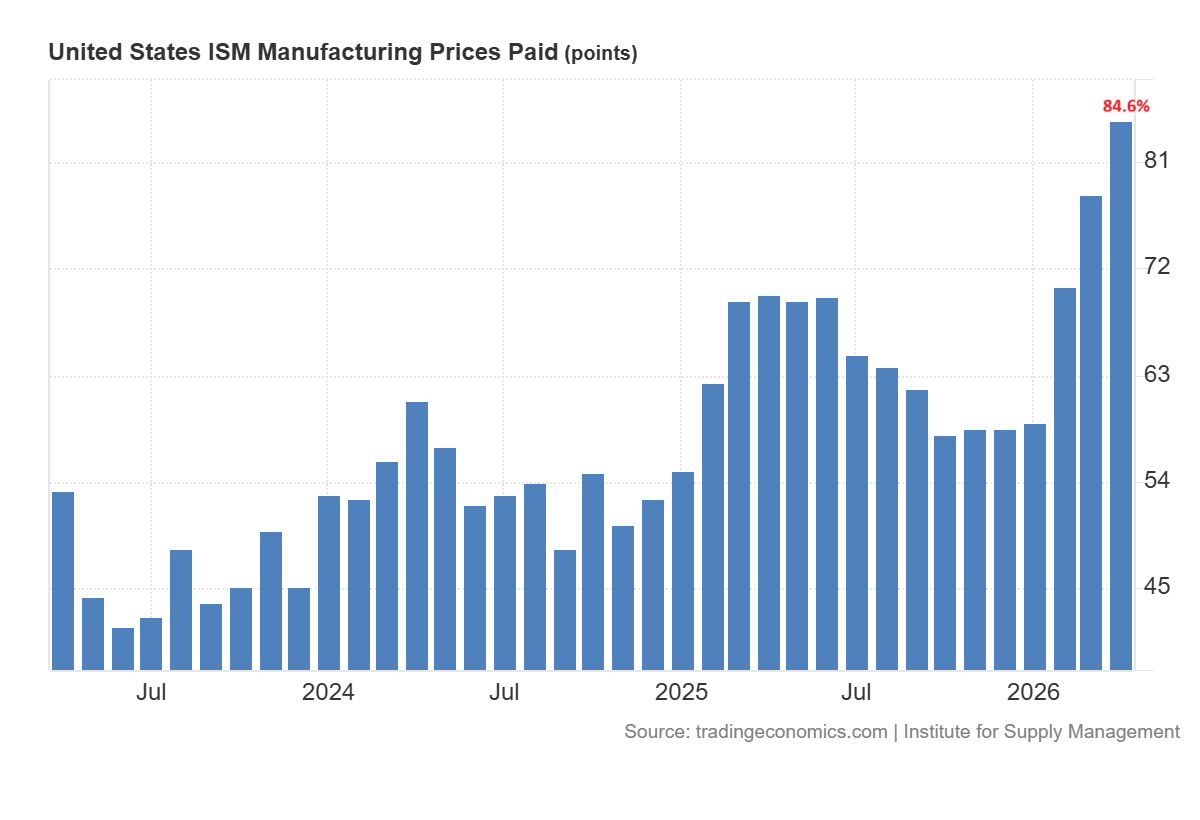
Producer prices provide the best signal of inflation. The ISM producer prices index jumped to 84.6% in April. This indicates that there is a sharp increase in input costs. The closure of the Persian Gulf is already beginning to impact the cost structure of the economy. At first, some of the increase may be absorbed by businesses. However, when prices are not lower, they are likely to pass them on to customers within 1 to 2 months.
PCE inflation has already soared to 3.5% with core PCE at 3.2%. The gap between headline and core inflation can be bridged when energy costs flow through the system. This is important to gold since real returns confidence can be undermined by sticky inflation. It can also maintain the attention of investors on assets that safeguard purchasing power.

The most important catalyst is oil. After probing resistance around $120, Brent crude retreated to support around $110. Strategic reserve draws may limit prices in May. However, this relief can be short-lived since the big importers like China may come back to the market and reestablish reserves.
These catalysts provide a positive but unstable environment for the gold market. The metal is supported by loose liquidity. Lack of confidence contributes to defensive demand. Increasing energy prices have made inflation risk still alive. Nonetheless, high Treasury yields may continue to put a limit on rallies in the short term. In my view, the next move in gold will depend on whether yields break higher or inflation pressure forces investors back into hard assets.
Gold Technical Analysis: $4,500 Support and $5,000 Breakout in Focus
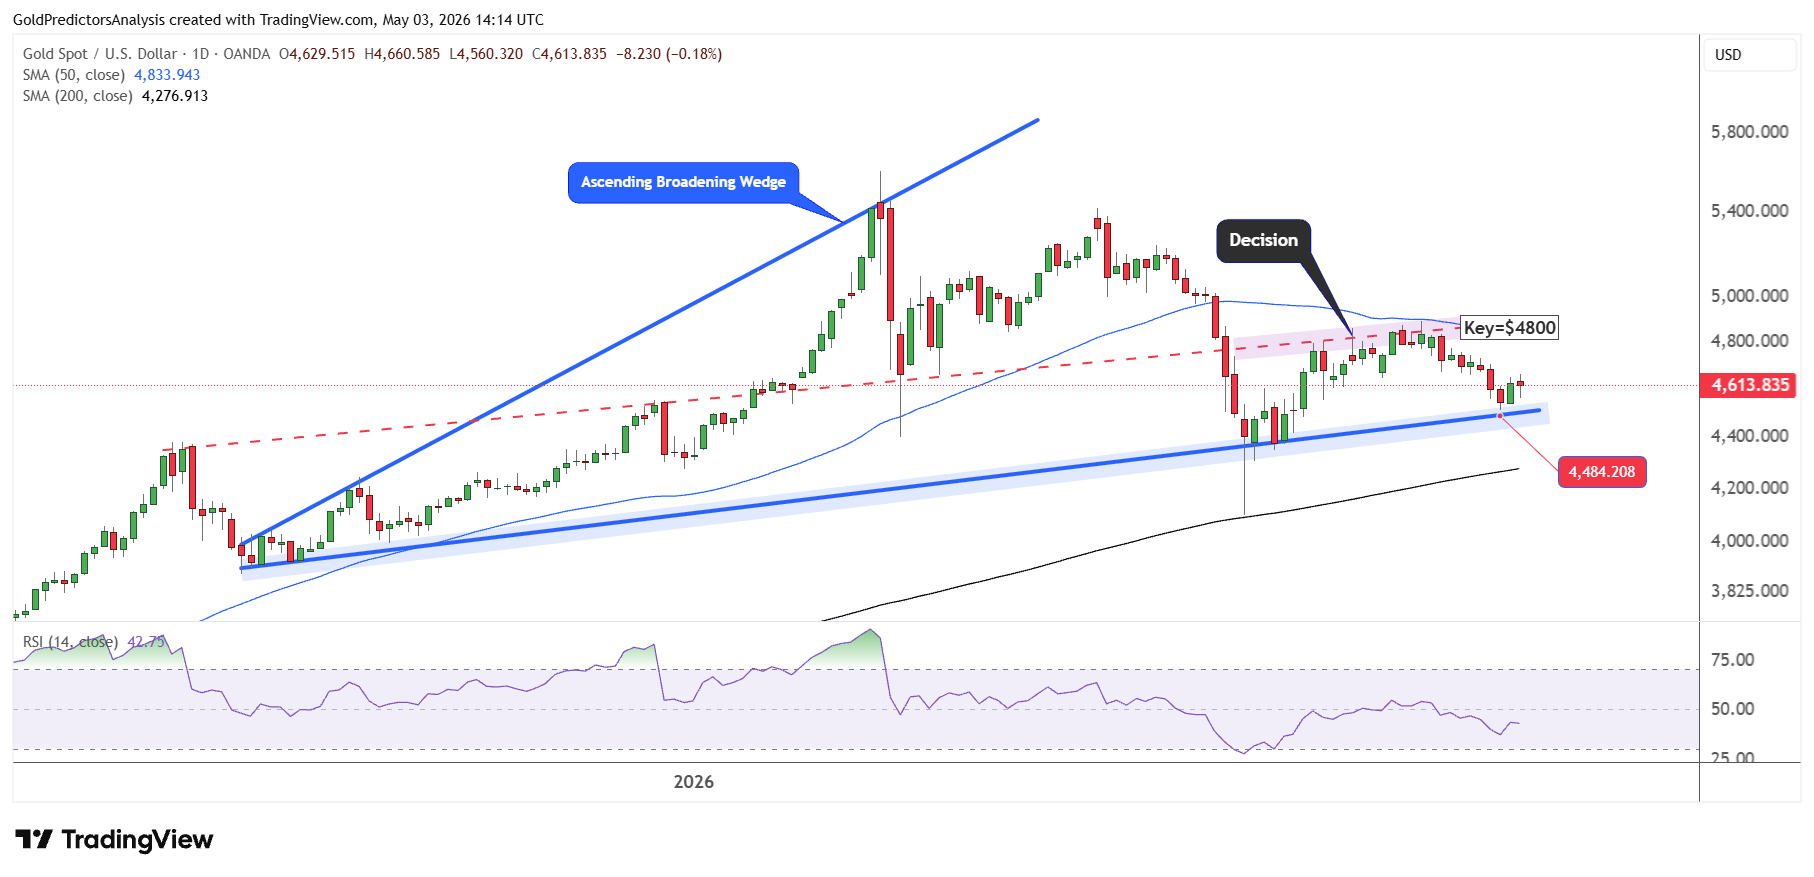
The gold price dropped last week towards the support of the ascending channel pattern within the bullish trend. However, the price failed to close below the trend line and closed at $4,613 exactly at the trend line.
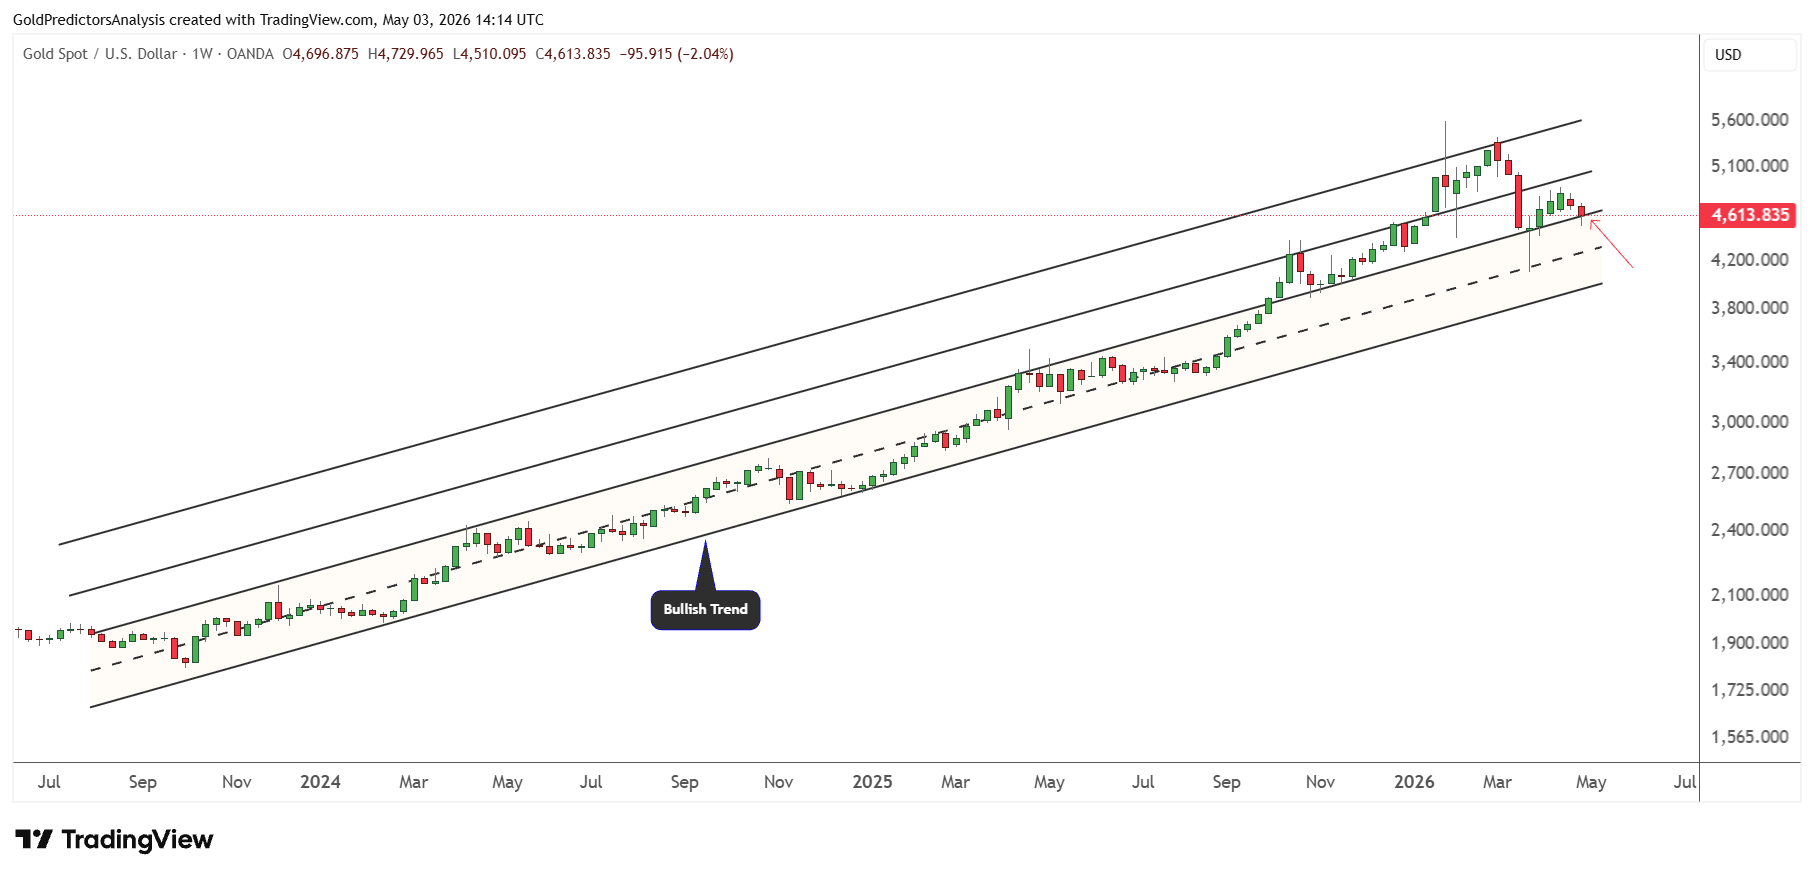
This indicates that the bullish momentum is still alive. This bullish momentum depends on the developments in the Middle East. This setup indicates that the price is consolidating within a tight range and looking for the next direction. As long as the price remains within this ascending channel pattern above the $4,000 area, the next move in the gold market will likely be stronger and higher.
The bullish trend is also observed from the ascending broadening wedge pattern, which shows that if gold prices break below the $4,000 area on Middle East crisis, then the next move in the gold market will likely be toward the lower support of the $3,500 to $3,700 area.
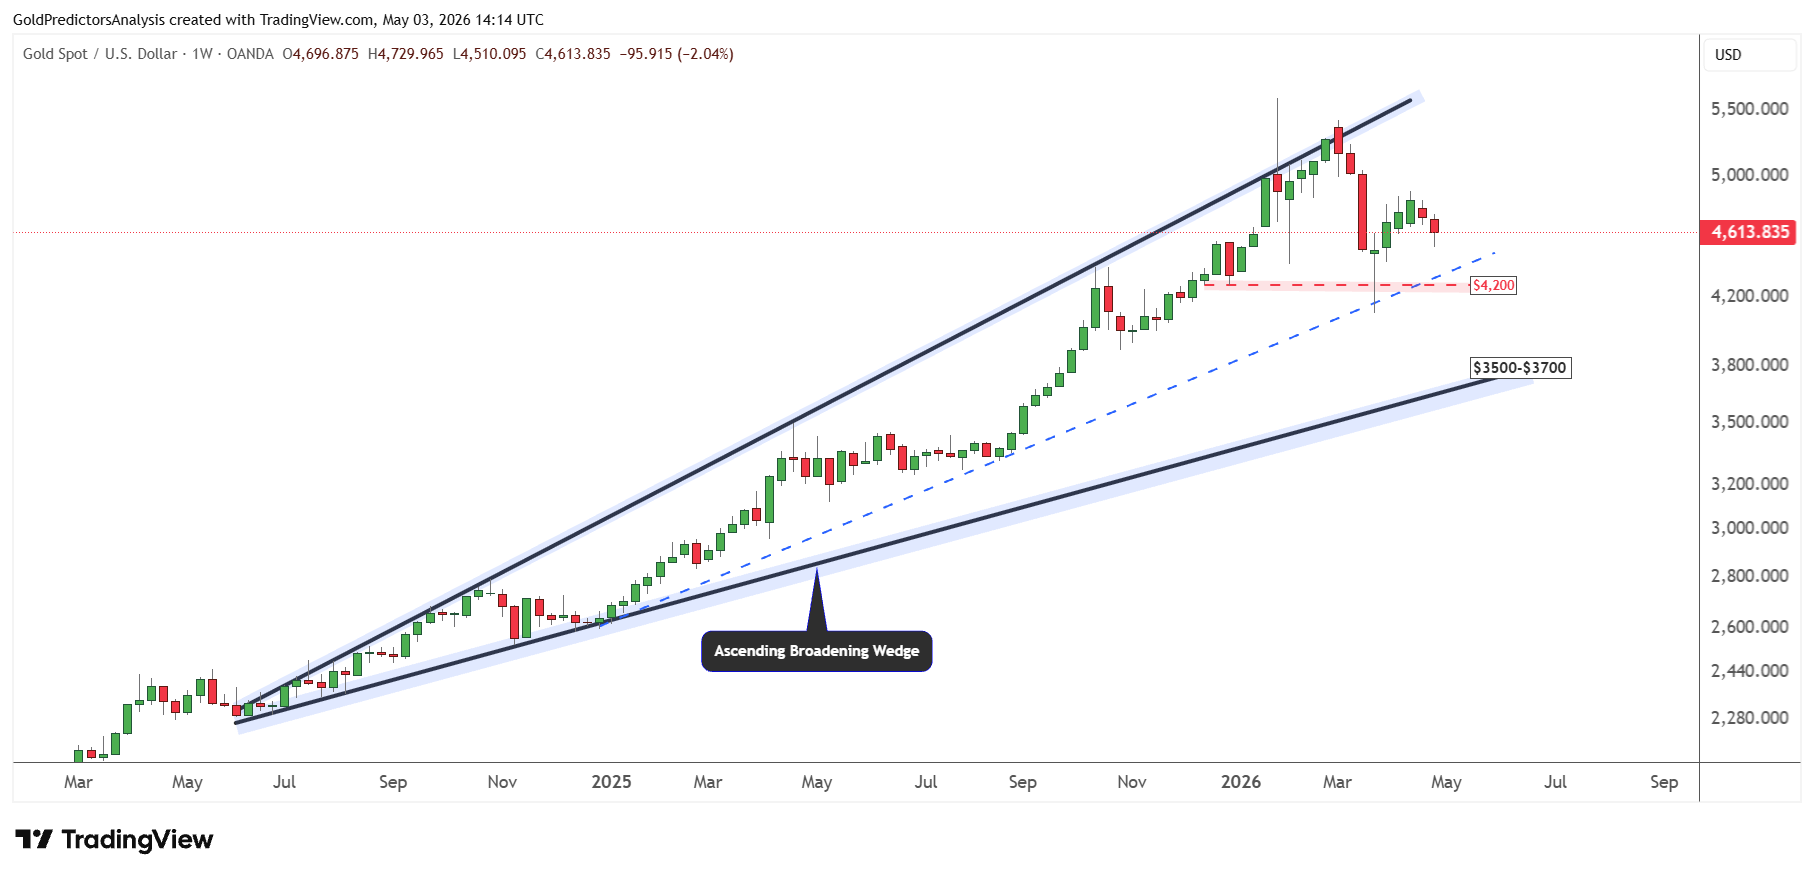
This support zone is seen as the support of the ascending broadening wedge pattern. However, the gold price will likely mark a long-term bottom at this level, where physical buyers may come in to rally towards the $7,000 area in the next cycle.
The short-term structure for the gold price shows that the price failed to break above the key $4,900 area on the daily chart. This decision line has been discussed during the last few weeks. The price failed at this key area and continued to drop towards the $4,400–$4,500 region as defined by the ascending broadening wedge pattern.
A break below $4,400 will drop the price towards the $4,280 area at the 200-day SMA. However, the short term price action remains confined within the range of $4,400 and $4,900. A break above $5,000 will indicate a strong surge in gold price towards $5,600.
Market Risk
The main risk for gold comes from Treasury yields. The 10-year yield is still testing the 4.4% resistance area. When the yields break out, there will be short-term strain on gold since the investors will demand higher returns on the interest bearing assets. The increased pressure can be introduced by a stronger U.S. dollar. A break above 100.50 in US dollar index will strengthen the US dollar and put pressure on the gold price.
The other risk is a cooling in the Middle East crisis. The energy induced inflation and safe-haven demand continue to support gold in the long term. However, the sentiments are driven by the new headlines. A break below $4,000 in spot gold will take more time to stabilise the gold price.
Final Words
Gold remains in a bullish structure, but the next move depends on yields, the U.S. dollar and Middle East developments. The loose financial conditions continue to support hard assets while weak consumer confidence and rising energy costs keep inflation risk alive. However, the 10-year yield near 4.4% can limit the short term upside. This means gold may continue to consolidate before the next major breakout.
From technical perspective, the $4,400-$4,500 region remains the key short term support zone. A break below this area may open the way toward the 200-day SMA near $4,280. However, as long as gold holds above the broader $4,000 support area, the long term bullish case remains active. A break above $5,000 would confirm renewed upside momentum and may push gold toward $5,600 in next phase.
If you’d like to know more about how to trade gold and silver, please visit our educational area.