



Gold (XAU) prices have bounced off the $4,400 to $4,500 support area as renewed fiscal support, elevated energy prices and stagflation fears continue to underpin a long-term bullish argument. I believe this retracement is more likely to be a consolidation of strong upward trend than a reversal. This article discusses how fiscal deficits, the S&P 500-gold ratio and technical levels could determine whether gold rebounds to $5,000 or tests the $4,270 to $4,000 support zone.
Gold Price Drivers: Fiscal Deficits and Stagflation Keep Bulls in Control
Fiscal Support Keeps Nominal Assets Elevated
The macro environment is changing again in 2026 with more supportive U.S. fiscal policy. The One Big Beautiful Bill Act of July 2025 extended various tax cuts and created new tax exemptions. This is now flowing through the economy via bigger tax refunds and marginally lower tax bills for some taxpayers. It gives the fiscal policy some more juice and provides a bit more liquidity during tax time.
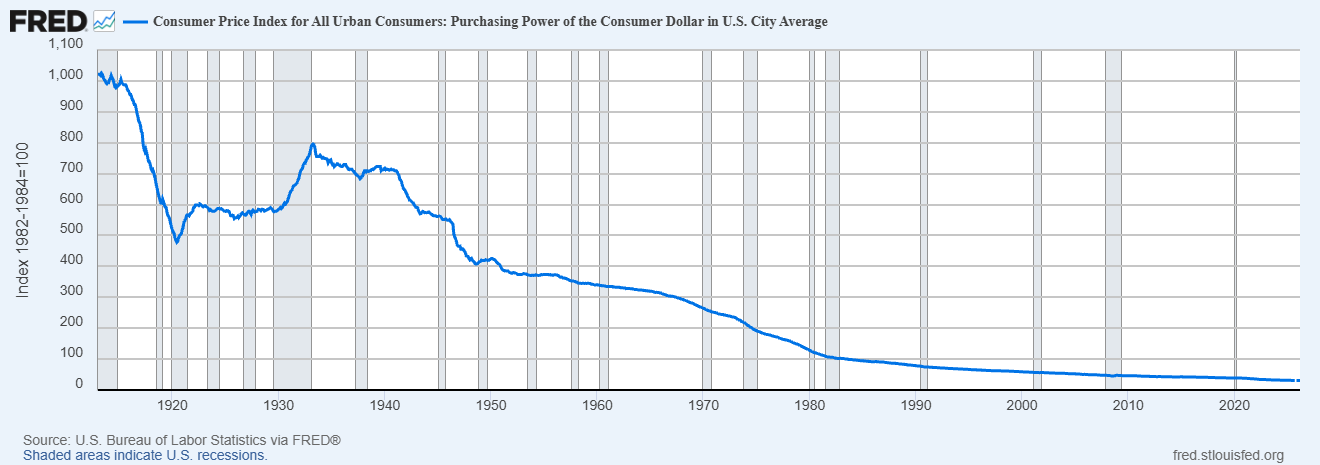
This is important for gold because fiscal policy remains the dominant policy in the U.S. economy. The deficits remain high despite pledges to trim spending. In these circumstances asset prices can increase in nominal terms because government expenditures inject money into economy. This nominal effect can be good for stocks, housing and banks. But the problem is that the US dollar loses its purchasing power over time. So gold is a measure of value.
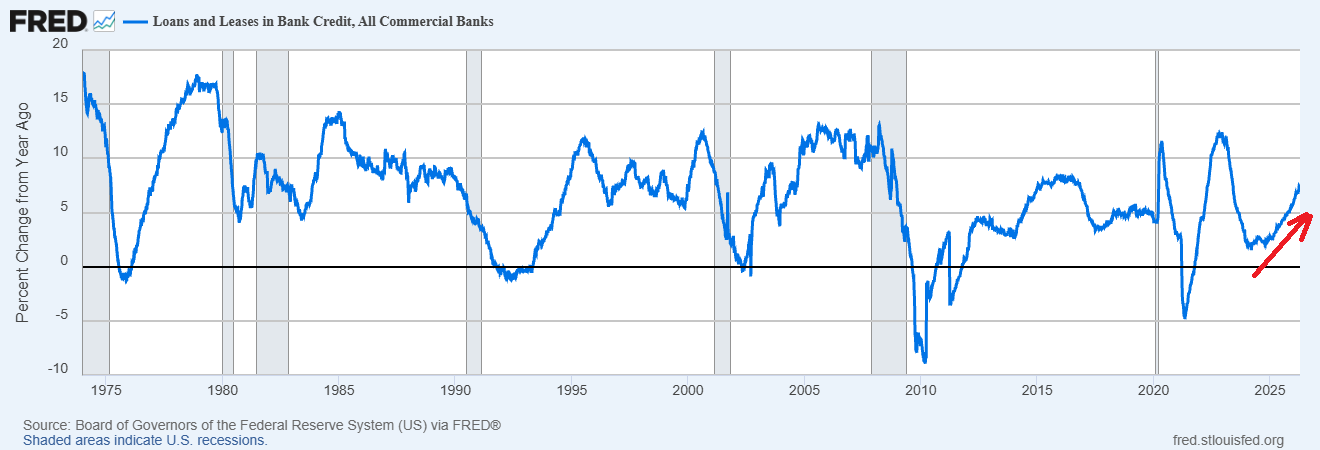
The chart below shows that the credit is still growing in absolute terms. The year-on-year bank lending growth has rebounded from 2023 to 2024.
So many assets can move higher in dollar terms, but do not keep up with gold. This has already happened in recent years. Equities and housing have posted nominal gains but have underperformed gold. This is consistent with a fiscal dominance regime where asset prices rise but are also more attractive as real assets. This is good for gold as investors seek capital preservation against currency debasement and future fiscal problems.
Gold Price Forecast
Every new Gold analysis as it publishes, today's technical signal and key levels, live price — on one page.
See all Gold forecastsEnergy Costs Keep Inflation Pressure Alive
The fiscal boost is not being felt across the economy. Rising fuel prices offset the impact of the bigger tax refunds for many. Oil prices also affect the economy. If prices remain high, they can push up transport, fertilizer and food prices. This prevents inflation from falling even with uneven growth.
Asset owners and the wealthy continue to benefit from fiscal deficits and rising asset prices. While lower income consumers are more affected by food prices, housing and borrowing costs. Moreover, younger households are struggling. This is why the current conditions indicate stagflationary environment. Inflation is high but the real economy remains weak.
This combination matters for gold. Stagflation is normally bullish as it signals slow real economic growth but persistent inflation. It can put stress on paper assets and boost the demand for safe haven assets. With continued loose fiscal policy and high energy prices, gold can serve as store of value as a hedge against inflation, deficits and reduced real incomes.
S&P 500-to-Gold Ratio: Breakdown Signals Gold’s Real Strength
The S&P 500 to gold ratio is an important indicator of real market sentiment. The S&P 500 can nominally appreciate from rising asset prices due to liquidity and budget deficits. But does not necessarily mean real gains for stocks. Stocks stagnating relative to gold suggests that gold is better preserving value than stocks.
This is the key point in the current fiscal dominance environment. U.S. stocks might keep benefiting from fiscal policy, corporate pricing power and liquidity. But gold can continue to perform if the market is more inclined to focus on currency debasement, inflation and fiscal risk. In this case, the S&P 500 can appear bullish on the surface but bearish relative to gold.
The chart below shows that the S&P 500 to gold ratio has broken the 1.70 level after forming a rounding top pattern, which indicates a strong negative trend. This negative trend suggests a healthy uptrend in the gold market. However, the ratio has now rebounded back to the breakout zone of 1.70 which is pulling the spot gold prices from the $5,600 back towards the $4,000. This recovery in ratio has also pushed the S&P 500 above 7,000. When the ratio hits the resistance of 1.70, it will likely confirm the bottom in gold for the next healthy rally.
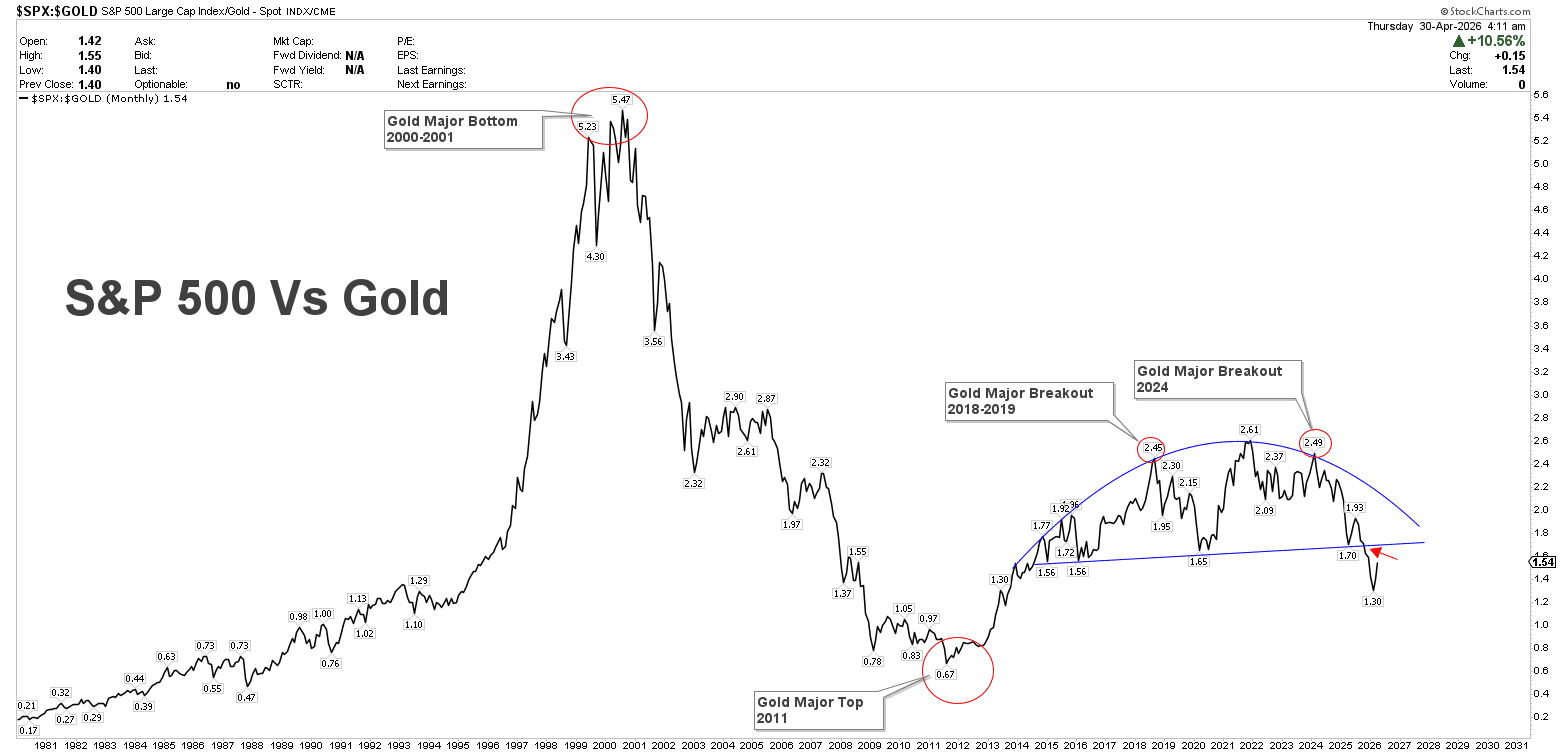
The re-acceleration in fiscal spending, high oil prices and stagflation remain supportive for the relative strength of gold against S&P 500.
Gold Technical Analysis: $5,000 Breakout Remains the Key Signal
The gold price hit the strong support region of $4,400 to $4,500 on Wednesday and initiated a rebound from the support zone. This support was defined by the ascending broadening wedge pattern, which indicates strong volatility.
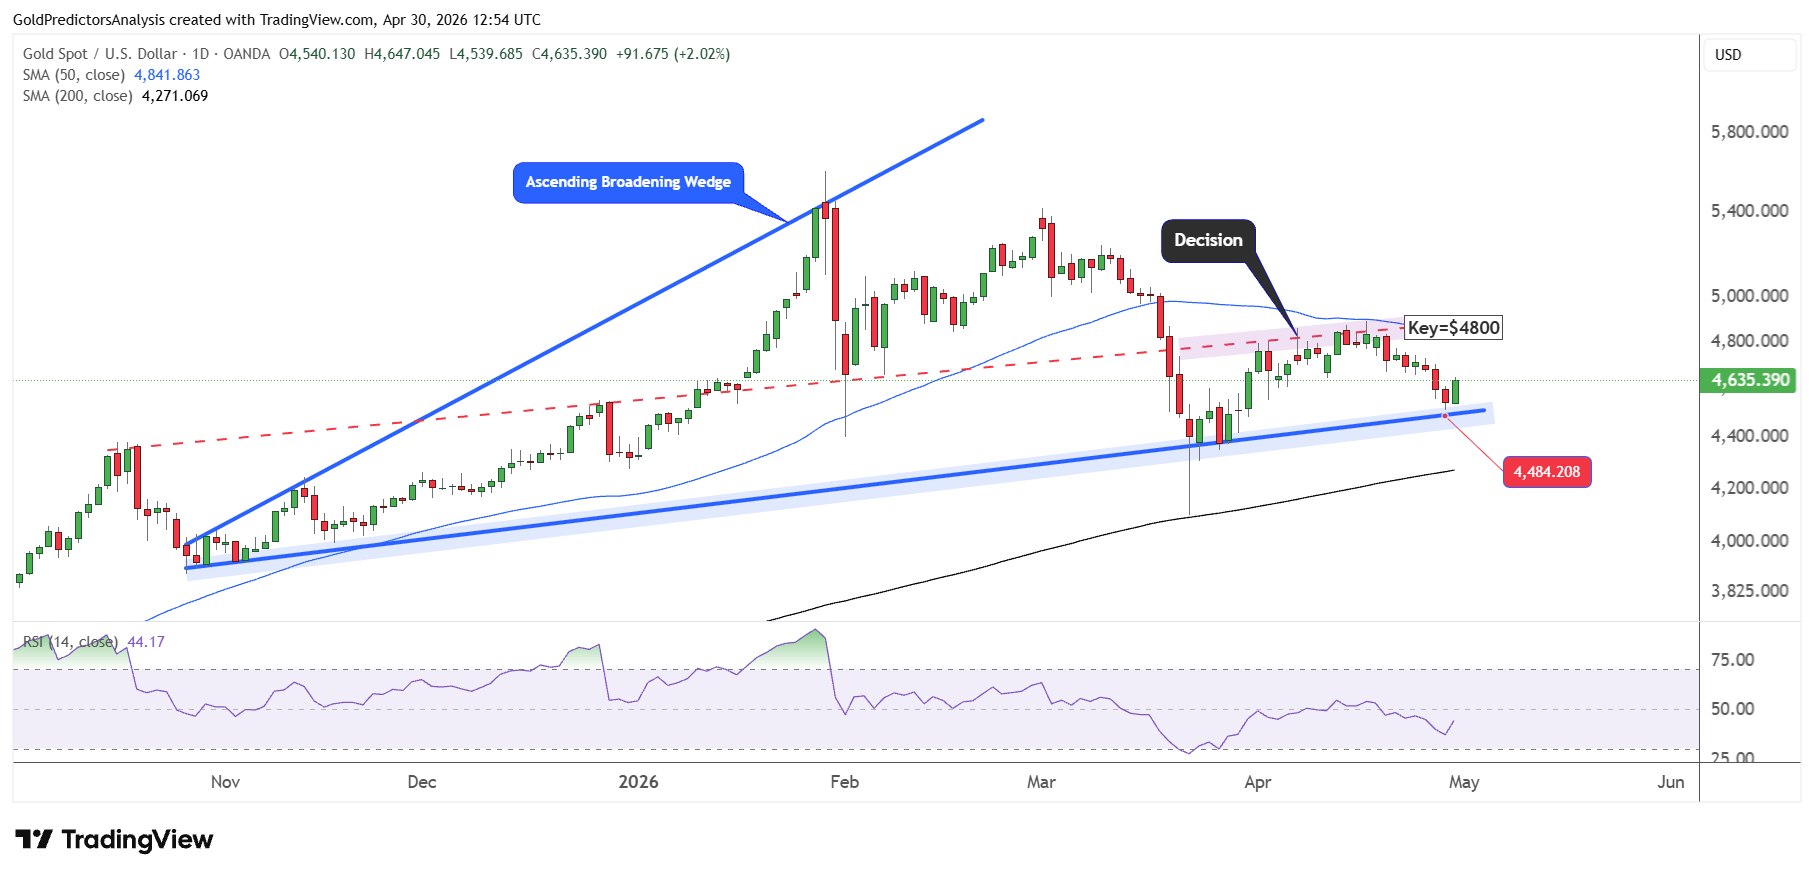
A recovery above $5,000 is required to keep the strong bullish momentum in the gold market. However, a break below $4,400 will push the price toward the 200-day SMA at $4,270.
This strong support is also observed on the weekly chart which shows the bullish trend within the ascending channel pattern. A break below $4,500 will likely push the gold price lower toward the $4,200 to $4,000. However, a recovery from $4,500 will likely push the price toward $5,000 as the immediate resistance.
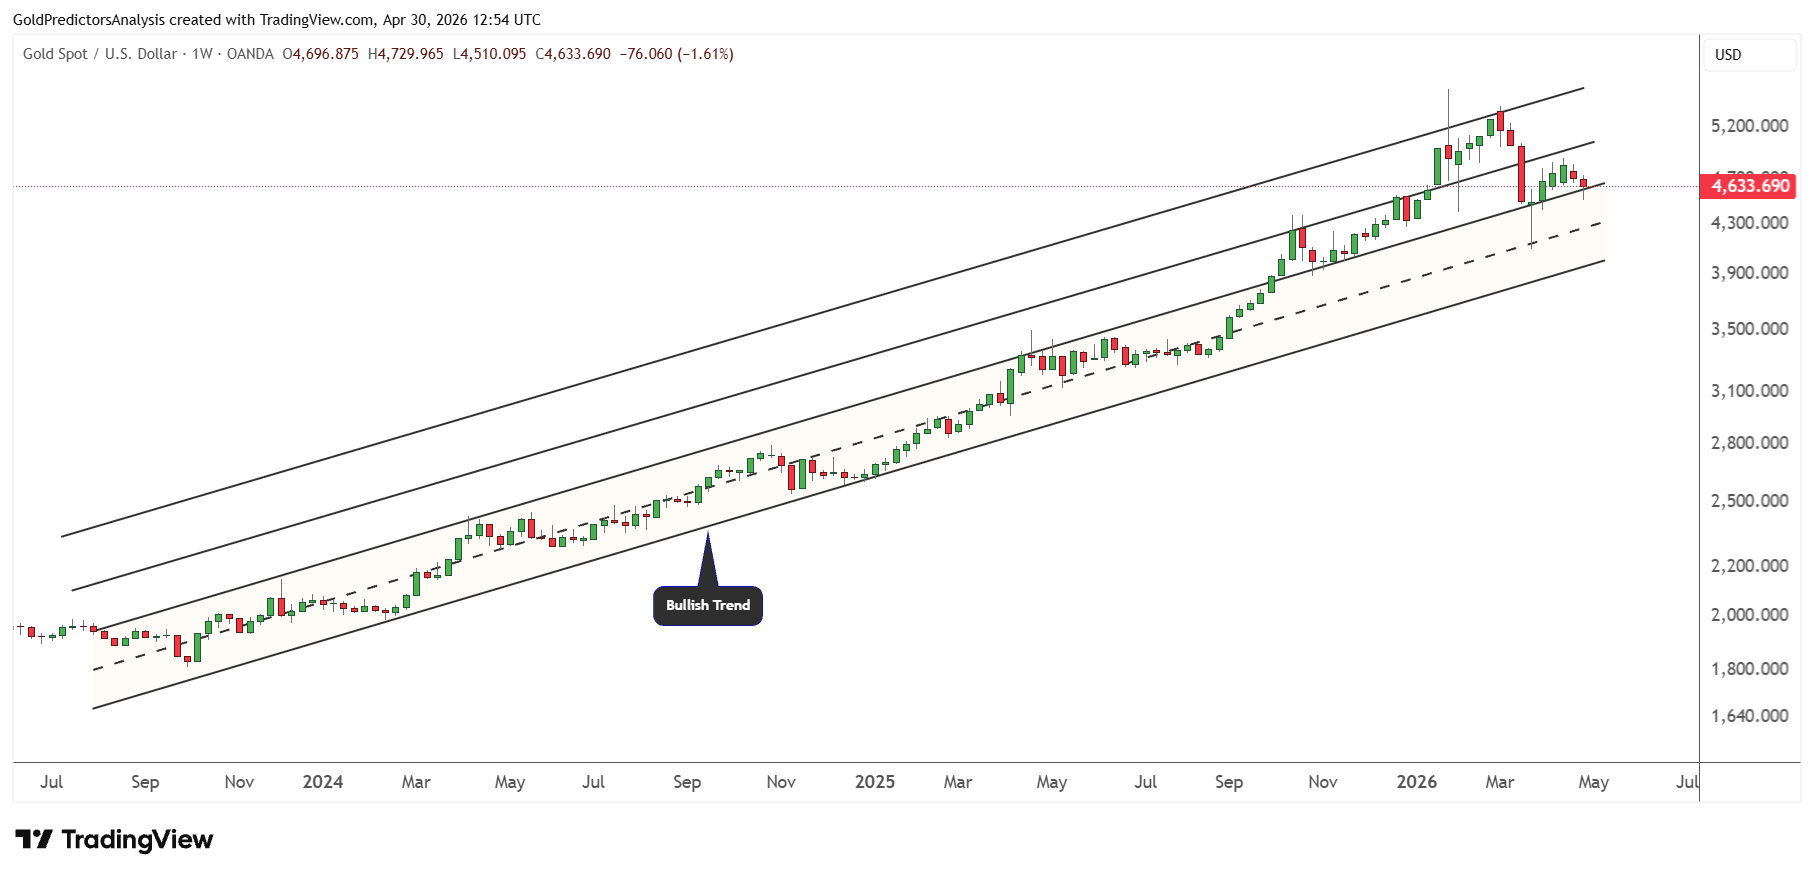
As long as gold remains between $4,500 and $5,000, the next move in the gold market remains uncertain. Despite this consolidation, the overall price structure in the gold market remains strongly bullish.
Market Risks
The biggest threat to gold is a stronger rebound in the S&P 500-to-gold ratio. It has already rebounded back towards its 1.70 breakout level, and this has dragged gold down from $5,600 to $4,000. If the ratio pushes back above 1.70 and stays there, it could be a sign that the bullish case for gold is being tested. This would signal a return to stock market investing and a move away from value.
A stronger U.S. dollar and an increase in real yields may also pose a threat. A stronger dollar could weaken demand for gold and higher real yields could make non-yielding assets less attractive. The US dollar index remains within the 100.50 and 96 zone. A break above 100.50 will signal that gold prices are likely to consolidate for longer before the resumption of the upward trend. The recent strength in the oil market is driven by US-Iran tensions and supply shock. This is pushing the Treasury yields higher which supports a short-term correction in the gold market.
Technically, if gold breaks below $4,400, it will increase downside risk towards the 200-day SMA around $4,270. Moreover, a break below $4,270 will push the prices to $4,000.
Bottom Line
The same fundamentals that have been driving the market are also supportive of gold. Fiscal policy is shifting to more supportive, bank credit is still growing and inflation is still high due to higher energy prices. This creates a stagflationary environment where stocks can grow in nominal terms, but gold can still outperform as a store of value. The negative trend in the S&P 500-to-gold ratio also confirms this hypothesis and demonstrates gold’s strength in real terms.
From technical perspectives, the $4,400 to $4,500 area is the main support. This can result in a recovery towards $5,000, while a clear break below $4,400 would suggest more downside risk towards $4,270 and $4,000. The direction is less clear between the $4,500 and $5,000 level, but the overall structure still points to gold as long as fiscal deficits, stagflation and real purchasing power remain the key concerns. As long as the gold remains above $4,000, the price will likely continue higher after the consolidation.
If you’d like to know more about how to trade gold and silver, please visit our educational area.