


Gold (XAU) is sliding toward the key support while investors shift back to U.S. equities. The Dow Jones breakout above 50,000 and the impressive rally in S&P 500 indicate that investors remain confident of the U.S. growth narrative. This turnaround has introduced short-term selling pressure in gold to push prices toward $4,000. But the long-term setup is still favorable for gold as the Dow Jones to gold ratio remains in a long-term bearish trend. This article discusses the Dow Jones to gold ratio and the capital rotation into equities to identify the next buying opportunity in the gold market.
Dow Jones to Gold Ratio Signals Long-Term Gold Strength
The Dow Jones to gold ratio is the indicator to examine the long term shift in gold. The chart below shows that the major gold tops occur at extreme support levels in the ratio. The gold price topped in 1980 following the historic inflation shock, lack of confidence in paper assets and strong demand for hard assets. In that time, investors rushed to buy gold because of inflation and the depreciation of the U.S. dollar. The Dow Jones to gold ratio dropped to the lower support zone, and gold formed a major cycle high.
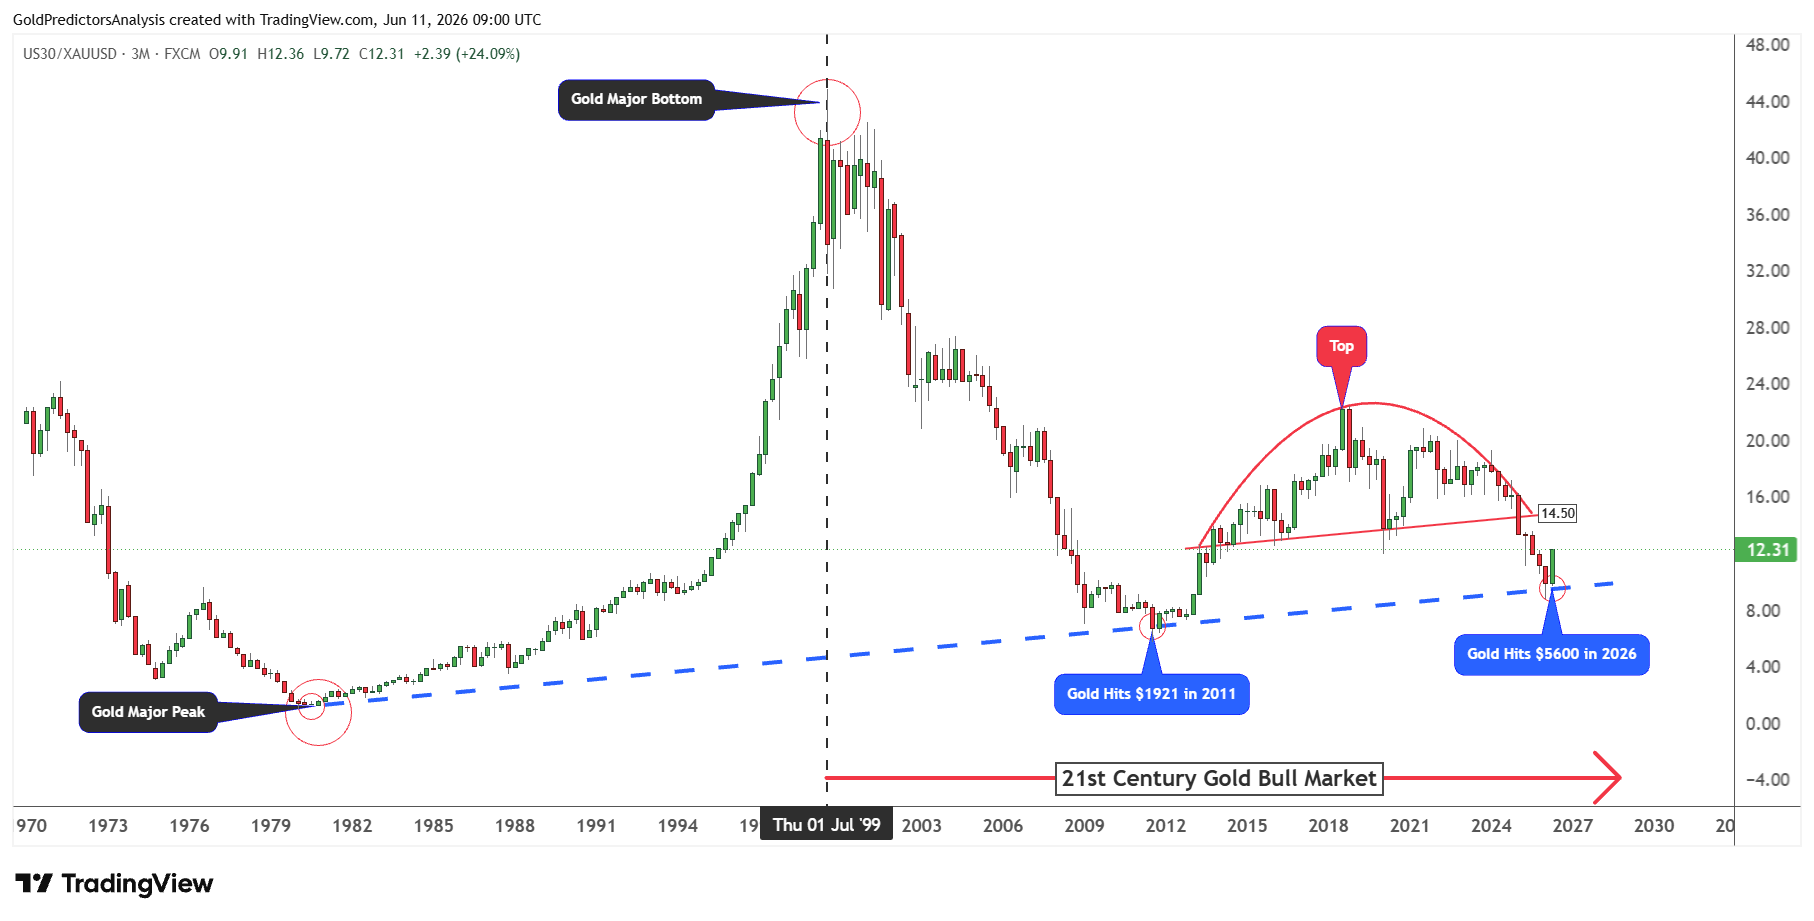
A similar situation developed in 2011. The gold price market topped following the global financial crisis, the eurozone debt crisis and the central bank easing. This surge was driven by the strong safe-haven demand and high real yields. The ratio again produced a bottom at support as gold prices hit a high of $1921.
In 2026, similar conditions emerged as the ratio again hit the blue support line when the gold price hit the $5,600. Since the ratio hit the blue trend line in 2026, the $5,600 high became the long-term resistance in the gold market.
Despite this strong rebound in the ratio, the overall structure suggests a bullish sentiment for gold. A large rounding top occurred in the Dow Jones to gold ratio with the high marked in 2018. This ratio has since been under long-term pressure. This suggests that the long-term trend is still in favor of gold.
The fact that the ratio is now bouncing off support could be the reason for the short-term gold downtrend. But the long-term trend for the ratio is bearish, which supports the long-term bullish outlook for gold.
Gold Price Forecast
Every new Gold analysis as it publishes, today's technical signal and key levels, live price — on one page.
See all Gold forecastsDow Jones Breakout Pressures Gold as Capital Rotates
A solid rally in value stocks within the blue-chip index helped the Dow Jones break above the 50,000 mark. This indicates that investors are not just buying mega-cap technology stocks. They are also switching to the large industrial, financial and cyclical names. That adds more depth to the Dow breakout and reinforces the case for a better growth story being priced into the U.S. stock market.
Growth-to-Value Rotation Confirms the Equity Shift
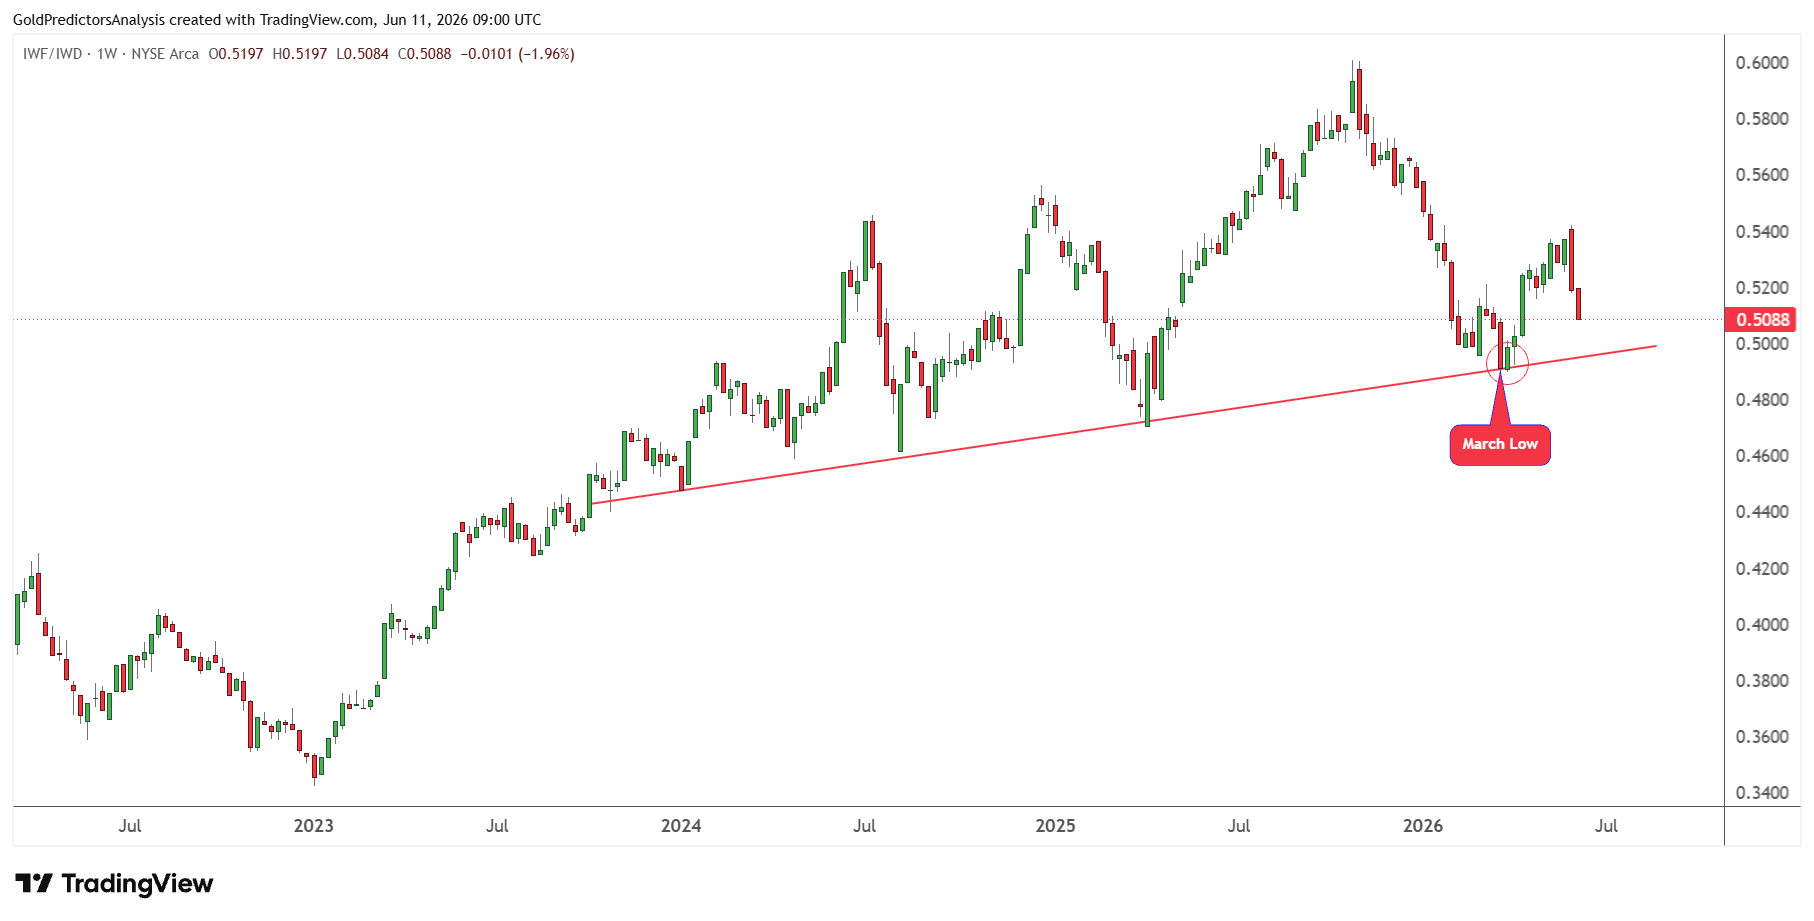
But the iShares Russell 1000 Growth ETF (IWF) to iShares Russell 1000 Growth ETF (IWF) ratio is now indicating a renewed trend of growth over value. This ratio turned around following the March low, but it is now heading down. The change poses a risk to the earlier turnaround and potentially indicates that investors are turning toward less growthy stocks.
A shift from growth to value will also echo the risk-off message from Bitcoin (BTC). Bitcoin has fallen below $70,000, indicating investors are pulling back on their speculative investments. This is important for gold as Bitcoin tends to be sensitive to changes in appetite for risk and liquidity. If Bitcoin fails to hold up as value stocks rise, the market could be in the midst of a more defensive period.
Treasury Yields and Jobs Keep Gold Under Pressure
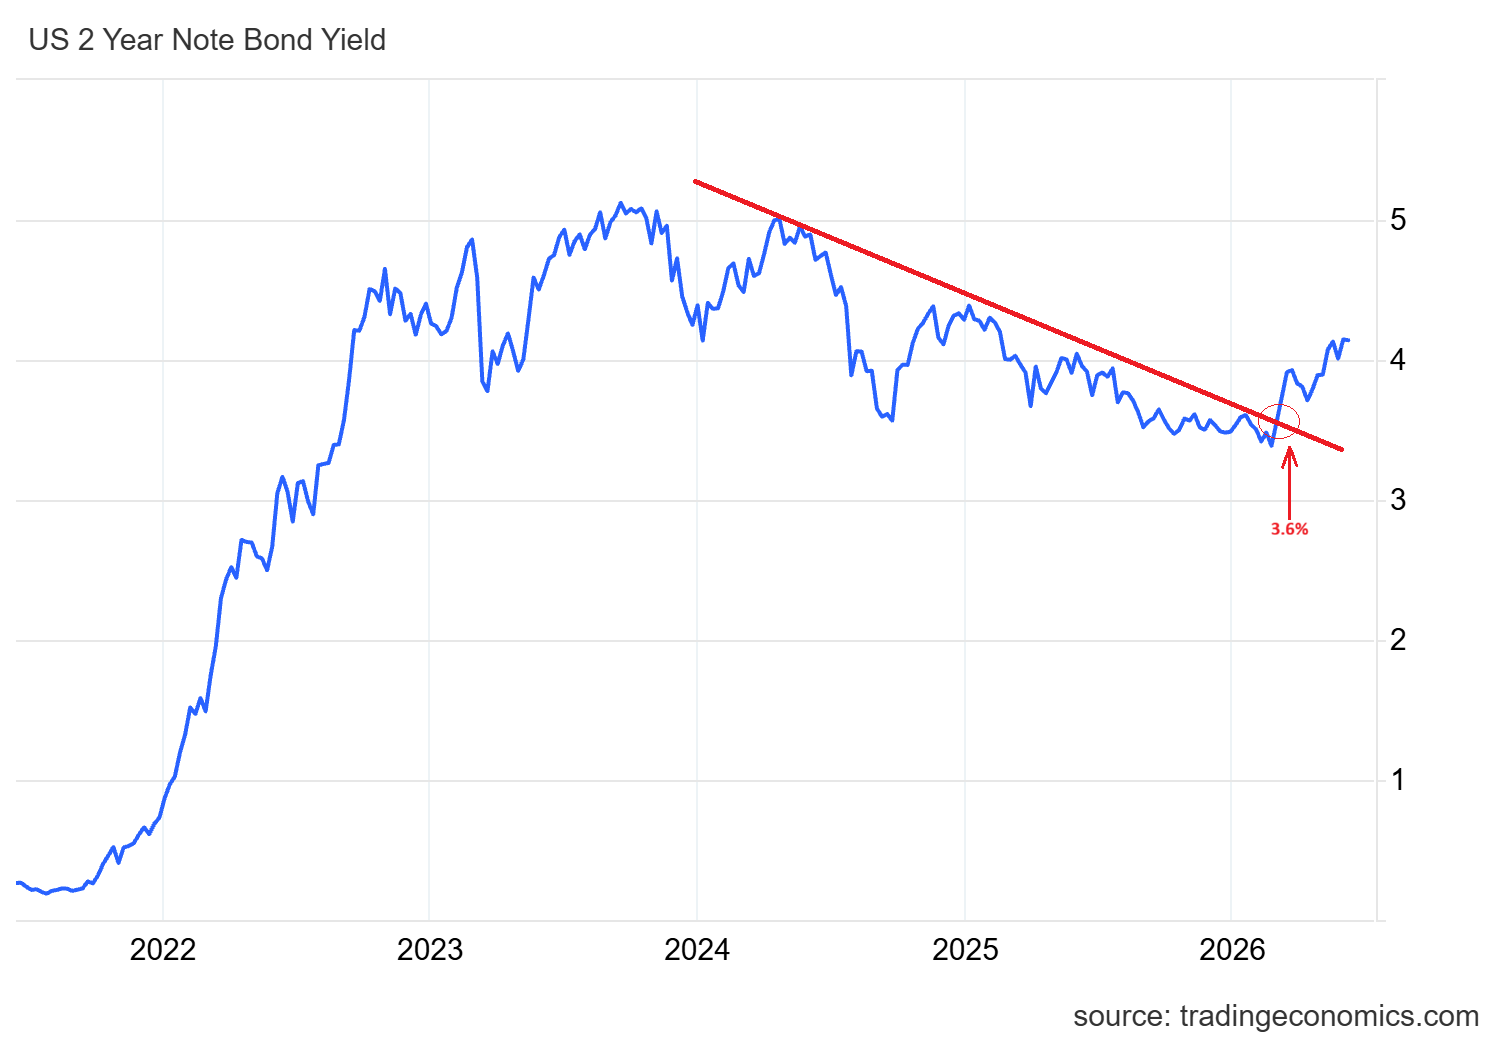
The Treasury market has also been altered by the war with Iran. The 2-year Treasury yield jumped above 3.6% at the beginning of March and ended its primary downtrend. The turnaround marked a loss of expectations of rate cuts. Now the rally in yields has pushed over the Fed funds target range of 3.5% to 3.75%, indicating that markets are beginning to factor in the higher risk for rate hikes.
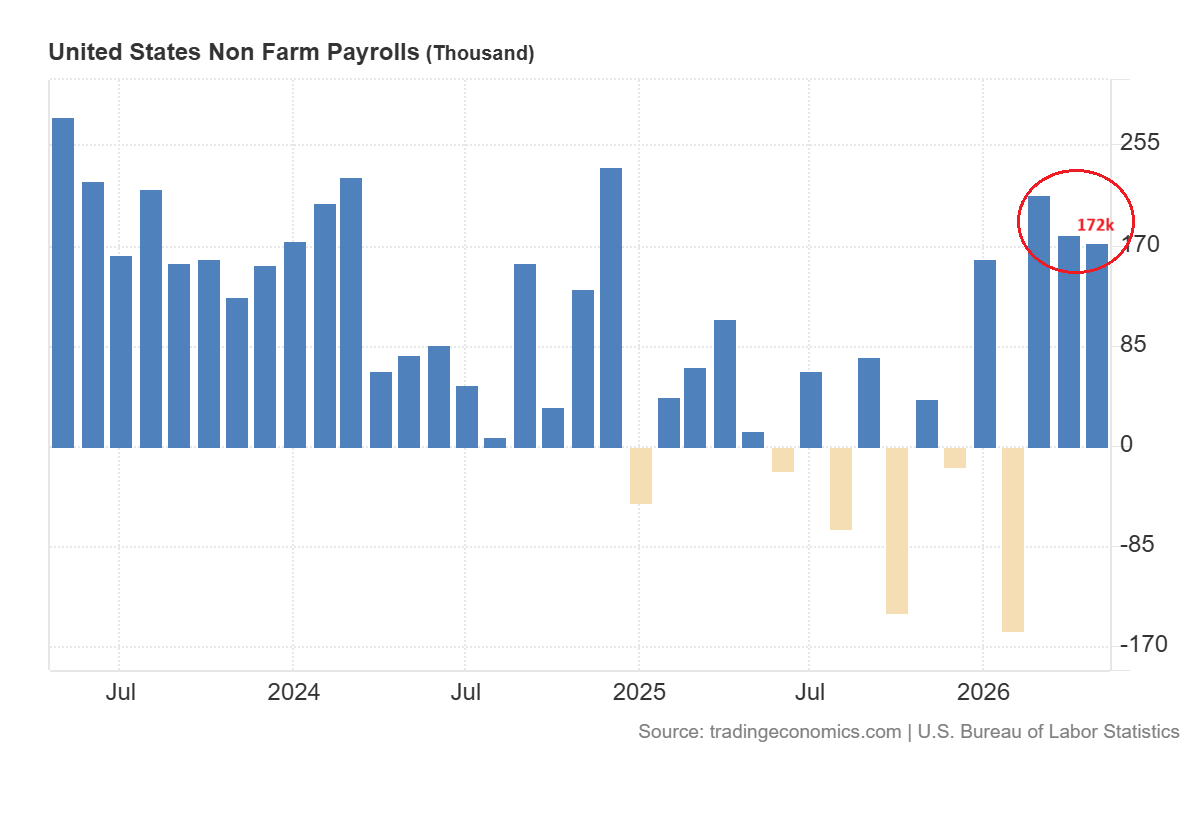
This pressure is compounded by the tight job market. The economy is close to full employment. The number of job openings has exceeded the number of unemployed for the first time in 12 months as seen in the chart below.
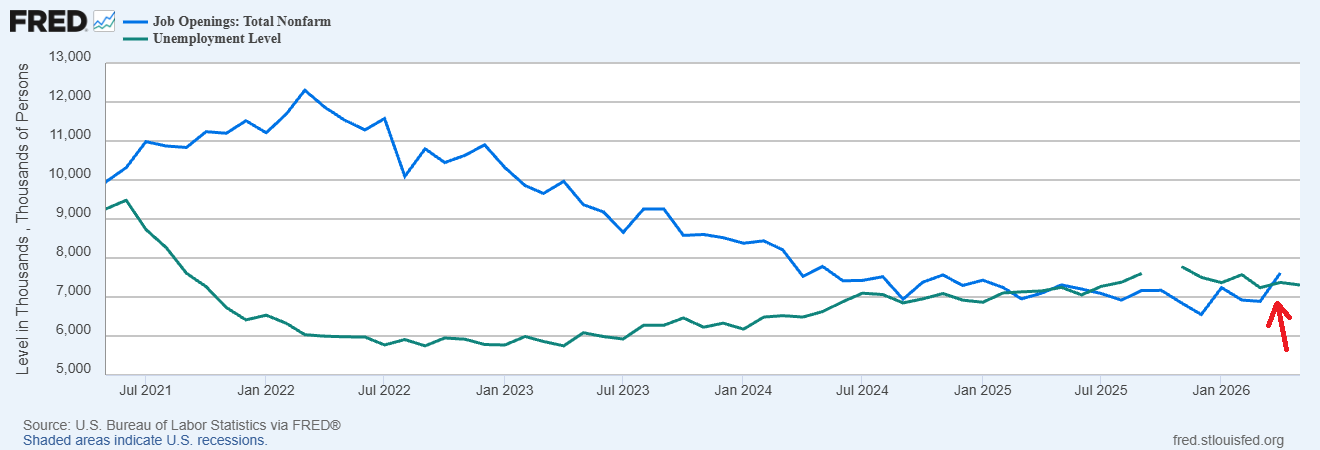
The job gains in May were 172,000 and the unemployment rate stayed low at 4.3%.
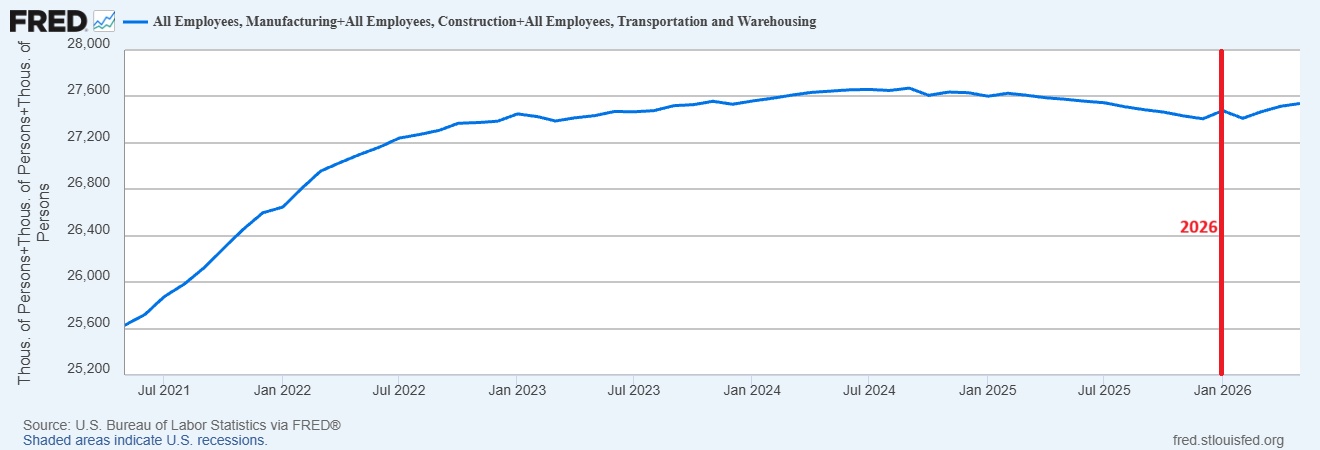
The cyclical employment is also improving with a steady decline in 2025 which reinforces the notion that the economy is resilient.
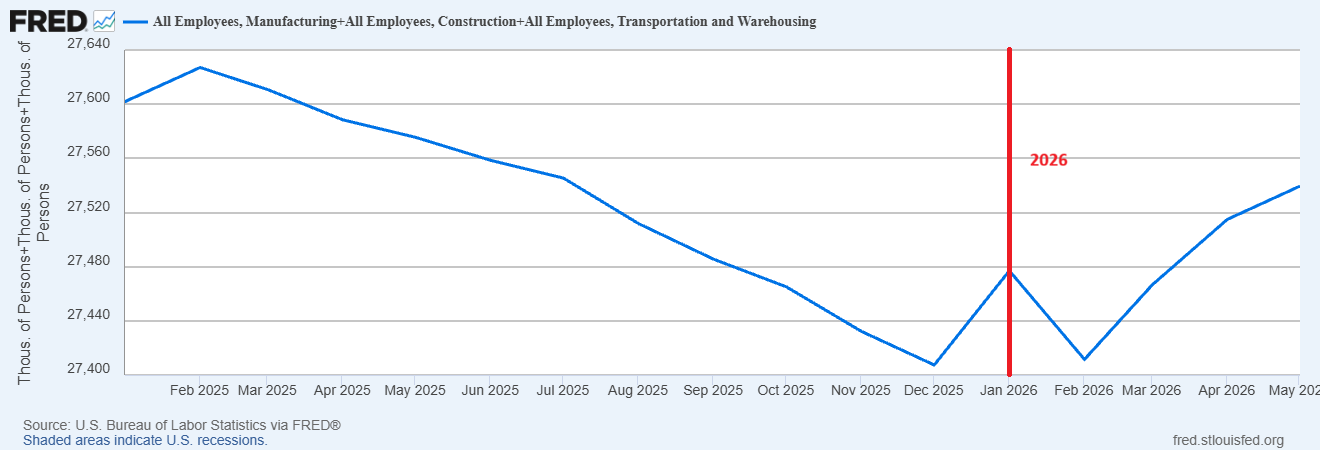
These solid jobs data helped drive the 2-year Treasury yield up to 4.15%. The positive shift in US Treasury yields keeps gold under pressure while the Dow Jones remains strong.
The Dow Jones’ correction into the 50,000 breakout zone appears to be a good correction. A retest of this breakout area could provide new buy opportunities for stocks. But this does not take away the long-term bull market for gold. As long as the Dow is in the vicinity of 50,000 and yields are high, gold could continue to drop towards the support zone to find new buyers.
Gold Price Tests the $4,000 Support Zone
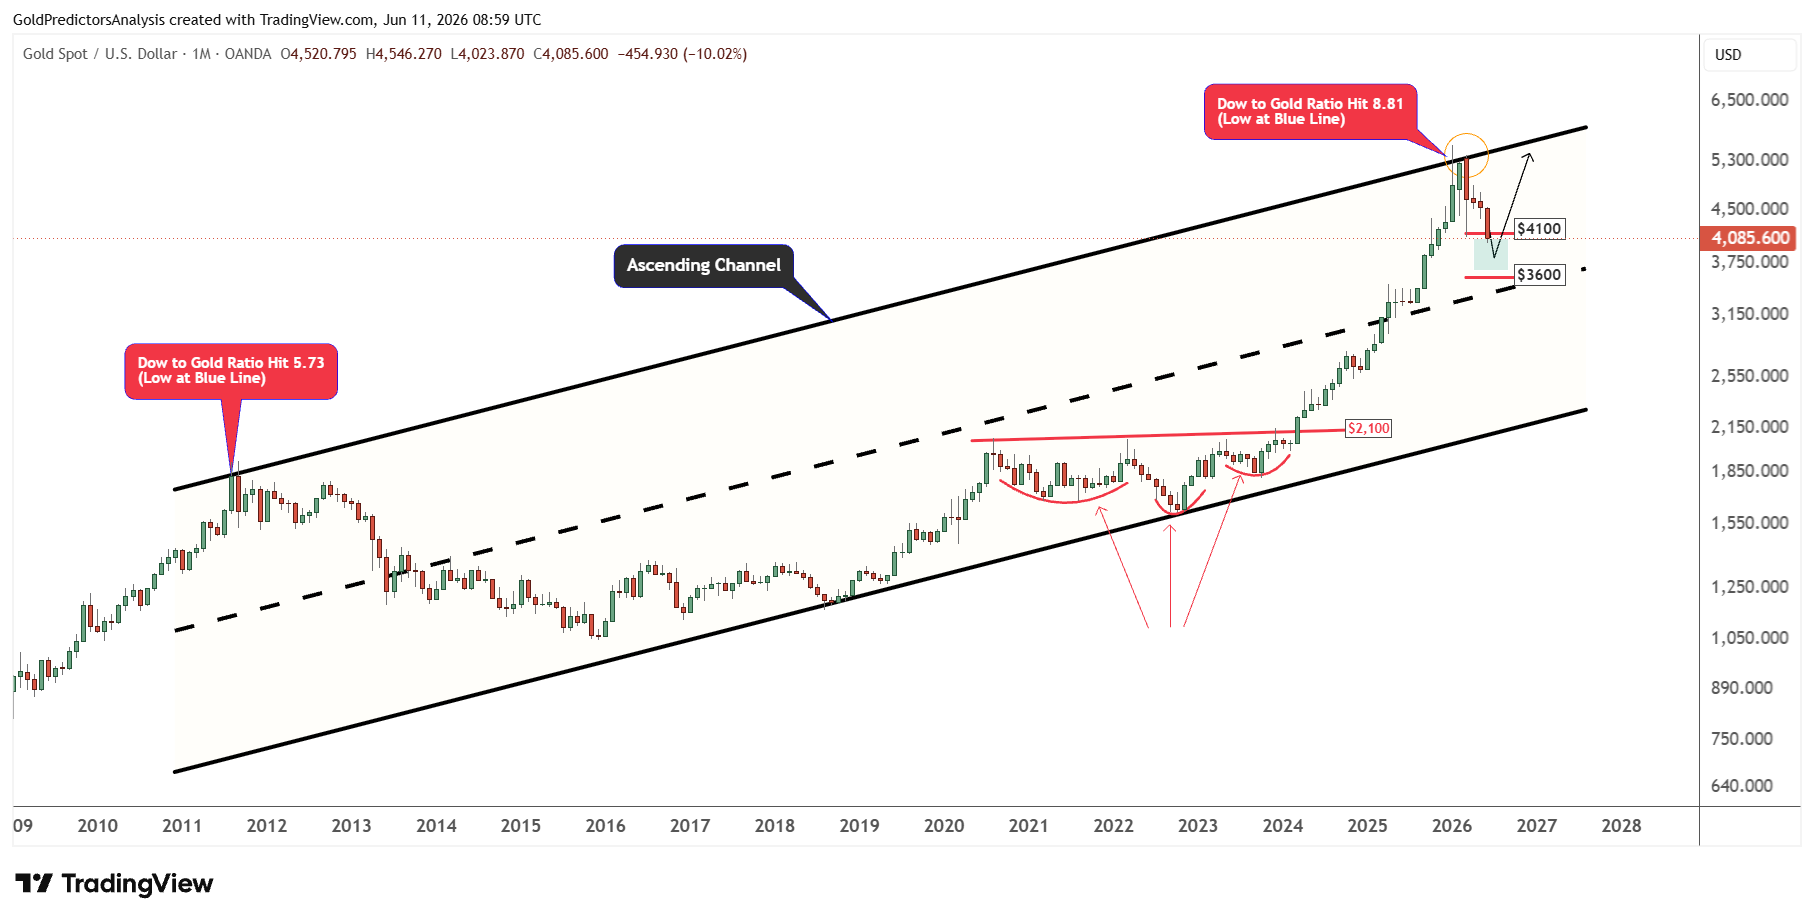
From technical perspective, the recent correction from $5,600 developed from the ascending channel pattern. This channel has formed from the 2011 peak to the recent highs.
The resistance at this channel highlights the blue trend line on the Dow Jones to gold ratio. This trend line stretched from 1980 to 2026.
It shows that when the gold price hit the high at $1,921 in 2011, the Dow Jones to gold Ratio hit the blue trend line at 5.73. When the Dow to gold ratio hit the blue trend line again in 2026 at 8.81, the gold price hit $5,600 to trigger profit-taking.
This is the reason for the strong correction from the recent highs. But the formation of the rounding top in the ratio indicates that the overall trend in gold remains bullish. Therefore, this profit-taking will likely provide a strong buying opportunity in the gold market.
The first buy zone in gold remains within $3,500 to $4,000 as discussed in previous updates. Now, the price has already hit $4,000 for the second time but there might be a slight push down within the buy zone before the key reversal.
The emergence of an inverted head-and-shoulders pattern at the lower end of the ascending channel supports the long-term bullish trend in gold.
Risk Analysis
The primary risk comes from the US Treasury yields and Fed expectations. Investors could price in a greater rate hike risk if the labor market continues to show strength and the 2-year Treasury yield continues to climb. An increase in yields typically slows the demand for gold.
If the Dow Jones to gold ratio breaks above 14.50, it will increase the likelihood of a deeper correction in the gold market. If the ratio continues to trade above the 22 level, it will challenge the long-term trends in gold and will push gold into broader consolidation for a longer period. But a break below 5.73 in the ratio will likely trigger a strong surge in the gold market. If this develops, then the gold prices will likely continue to break the $8,000 level and ignore any short-term pullbacks.
What is Next?
Gold remains under short term pressure with capital shifting to U.S. stocks. Investors continue to believe in the U.S. growth story as the Dow Jones breaks the 50,000 mark and the S&P 500 rallies strongly. Higher Treasury yields and solid jobs data have also delayed the next bullish move in gold. This maintains the $3,500-$4,000 range as the crucial range for buyers.
But this correction is a healthy sign for the long-term trend. The Dow Jones to gold ratio remains in a long-term downtrend and has formed a large rounding top. This bearish trend is a bull signal for gold. It seems that the recent pullback from $5,600 is a profit-taking move rather than a key trend reversal. Investors may consider buying the gold prices within $3,500-$4,000 to target $8,000.
This analysis follows the previous gold setup where the Dow Jones breakout first started to pressure gold: Gold Price Forecast: Dow Jones Breakout Pressures Gold Near $4,500.
For more background on the study, read: Gold Rebounds from $4,500 Support as Dow Jones Breaks 50,000.