


Gold (XAU) prices dropped sharply below $4,800 after the Federal Reserve held interest rates steady. On the other hand, escalating tensions in the Middle East triggered sudden shift in market sentiment. This move may seem surprising as rising geopolitical risk and energy driven inflation support gold. In my view, this divergence signals deeper shift in macro environment that could shape gold’s next major move. This article presents the key drivers, technical structure and critical levels that investors need to watch.
Macro Outlook – Oil Shock and Fed Policy Shift Drive Gold
Oil and LNG Disruptions Trigger a Fresh Inflation Surge
Energy markets are sending a very strong signal. Iran’s attacks on critical infrastructure have caused disruptions in supply on a large scale. Qatar confirmed extensive damage to Ras Laffan, one of the world’s largest export hubs for LNG. This is important because Qatar accounts for almost 20% of the world’s LNG exports.
At the same time, the oil markets are tightening rapidly. Omani crude is trading at an extreme premium to Brent; Dubai crude premiums have also shot up. These moves are not based on speculation but rather on real fears of supply. Markets are now pricing in a shortage.
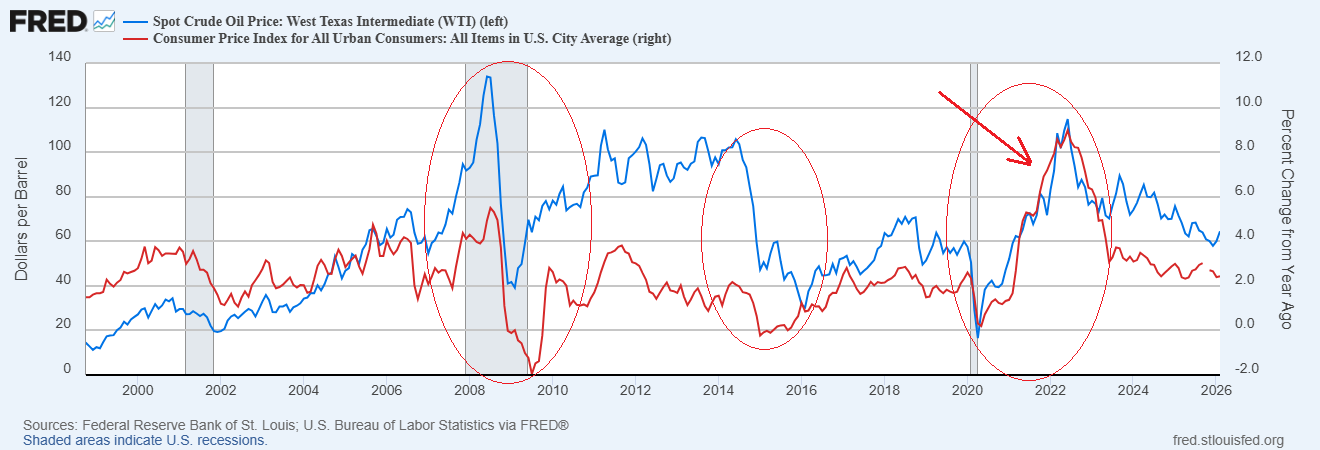
This type of energy shock is a direct feed into inflation. Increased WTI oil and natural gas prices increase transport, manufacturing and utility costs. The chart below shows that an increase in oil prices raises inflation as observed in 2007 and 2021. The recent spike in oil prices will likely take inflation higher in the next few months.
Rising inflation expectations lead to an increased demand for hard assets. Gold serves as a hedge against the loss of purchasing power of money. The current setup is conducive to a stronger long term bid for bullion.
Gold Price Forecast
Every new Gold analysis as it publishes, today's technical signal and key levels, live price — on one page.
See all Gold forecastsFed Policy Outlook Shifts as Energy-Driven Inflation Surges
The Federal Reserve’s policy outlook has shifted rapidly as energy driven inflation risks are emerging. The market was looking for rate cuts as growth slowed and labor market weakened. According to the latest data, labour market shed 92,000 jobs in February. The employment market has shown signs of weakness since 2025.
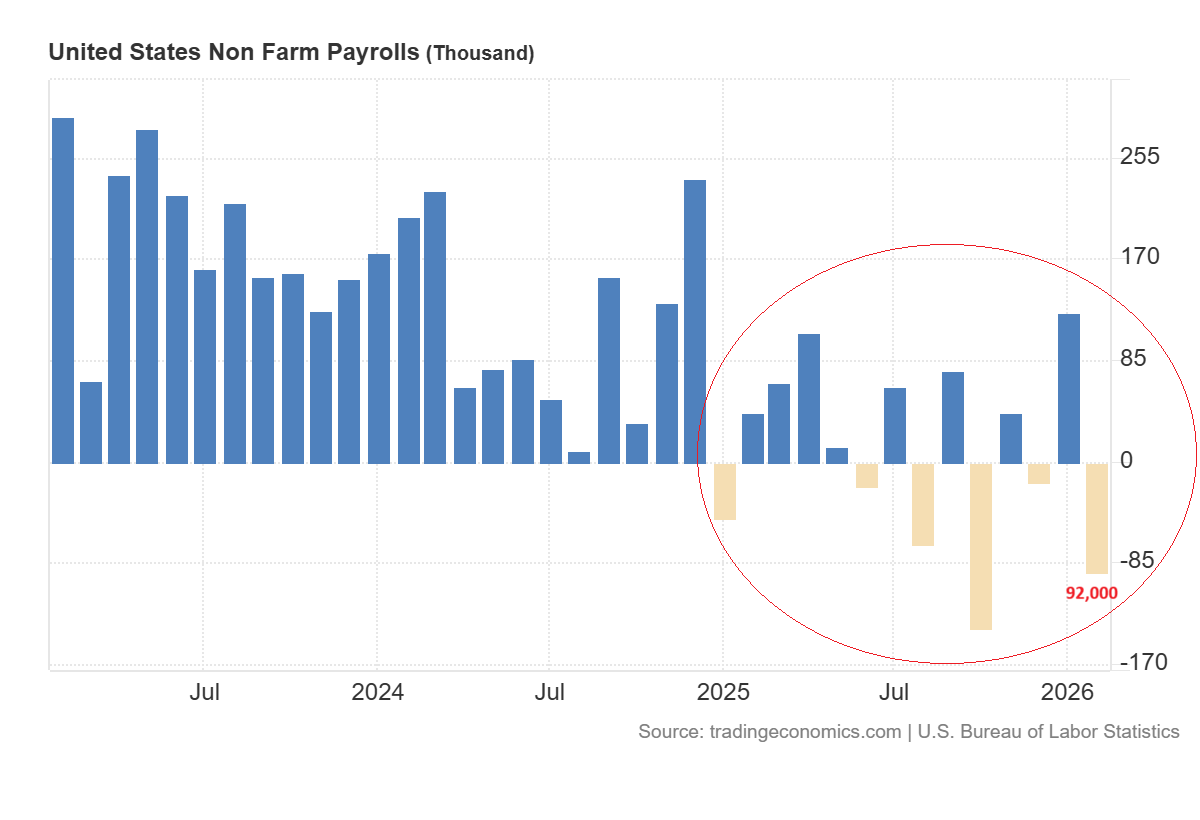
The Federal Reserve was on track to cut rates further with three cuts expected this year. However rise in energy prices has reversed that outlook.
The inflation was already on an upward trend with core inflation moving above the target as per the data of January 2026. According to the data, the core inflation has surged to 3.1% in January 2026, which excludes energy and food prices. Therefore, the rising oil prices will further take overall inflation to much higher levels.
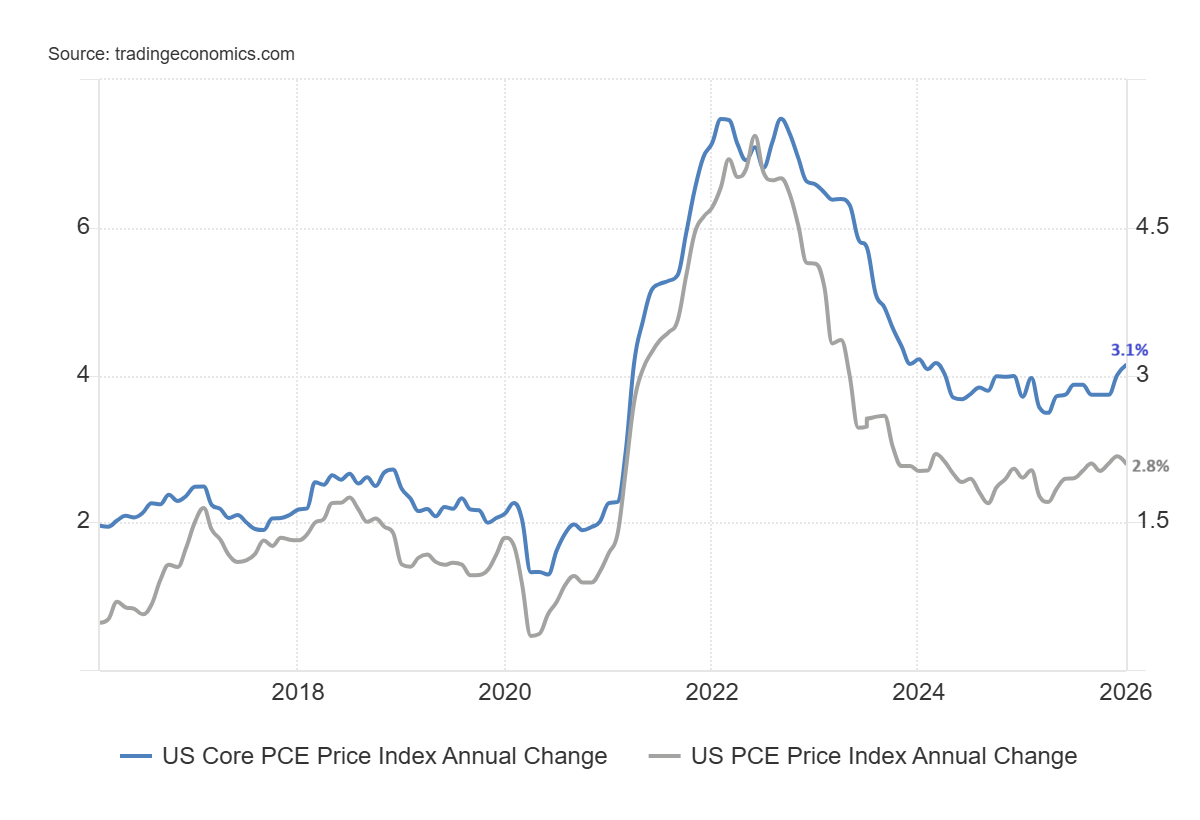
This environment keeps the Federal Reserve in difficult position. It cannot relax policy aggressively with inflation risks still high.
Therefore geopolitics is now influencing monetary policy. Energy supply shocks are making central banks cautious and reducing the Fed’s control over inflation cycle.
This environment creates bullish outlook for gold. As real policy flexibility declines, the confidence in fiat systems declines. Investors start searching for assets that are not linked to central bank decisions. This shift supports gold prices.
Rising Credit Stress Signals Tight Liquidity Across Markets
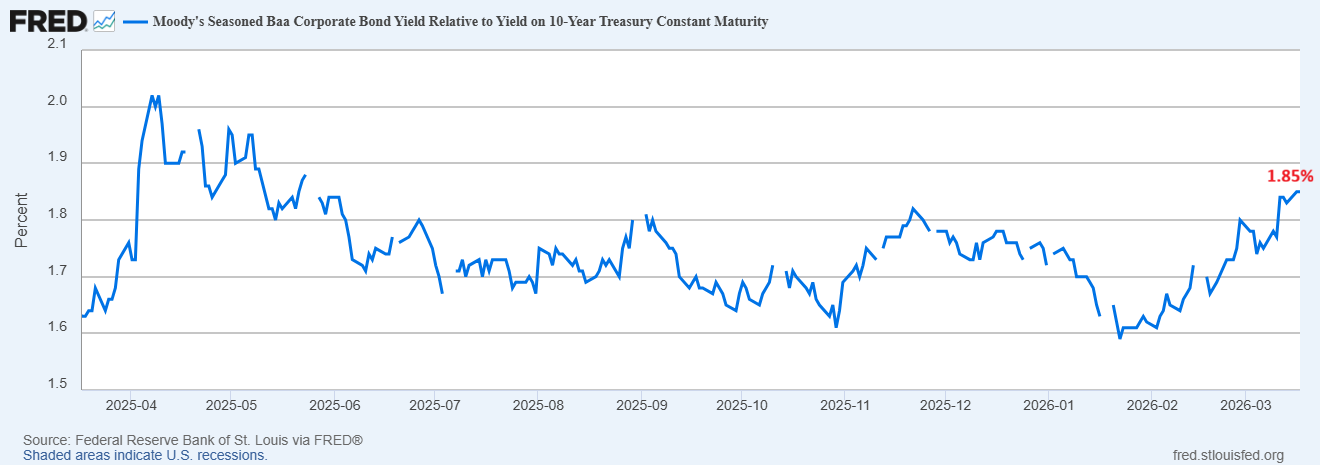
Financial conditions are also showing signs of stress. Credit Spreads have widened, which suggests tighter liquidity across markets. This implies that costs of borrowing are rising and risk appetite is weakening. The chart below shows that the Moody’s Baa corporate bond spread increased to 1.85% which warns of tighter liquidity in financial markets.
At the same time, government is faced with a difficult trade-off. High levels of debt restrict their capacity to sustain growth. Any aggressive fiscal response runs risk of adding more inflation. Policymakers are effectively caught between slowing down growth and higher prices.
This combination usually results in debasement of currency over the long run. When both monetary and fiscal tools become ineffective, investors move to stores of value.
This environment also supports the gold price. Gold is not reliant on earnings, credit conditions or policy decisions. As liquidity tightens and situations of macro uncertainty increase, gold becomes a preferred safe haven asset.
Technical Analysis – Gold Breakdown Triggers Volatility Within Bullish Structure
Gold Breaks Key Support as Volatility Surges
The gold price broke the support of the ascending broadening wedge pattern yesterday after the Fed left the interest rates unchanged. The escalation of war in the Middle East further supported the drop in the gold market. The daily close near $4,800 has increased uncertainty in the gold market. This has opened the door for further downside.
The chart shows a strong drop on 29 January 2026 from $5,600 to a low of $4,400 on 2 February 2026. The drop of over $1,000/ounce within just three days indicates that the gold price is already in highly volatile environment. This correction is due to strong profit taking after the surge in gold prices in 2025. However, the fundamentals remain strong and this correction will offer strong buying opportunity for long-term investors.
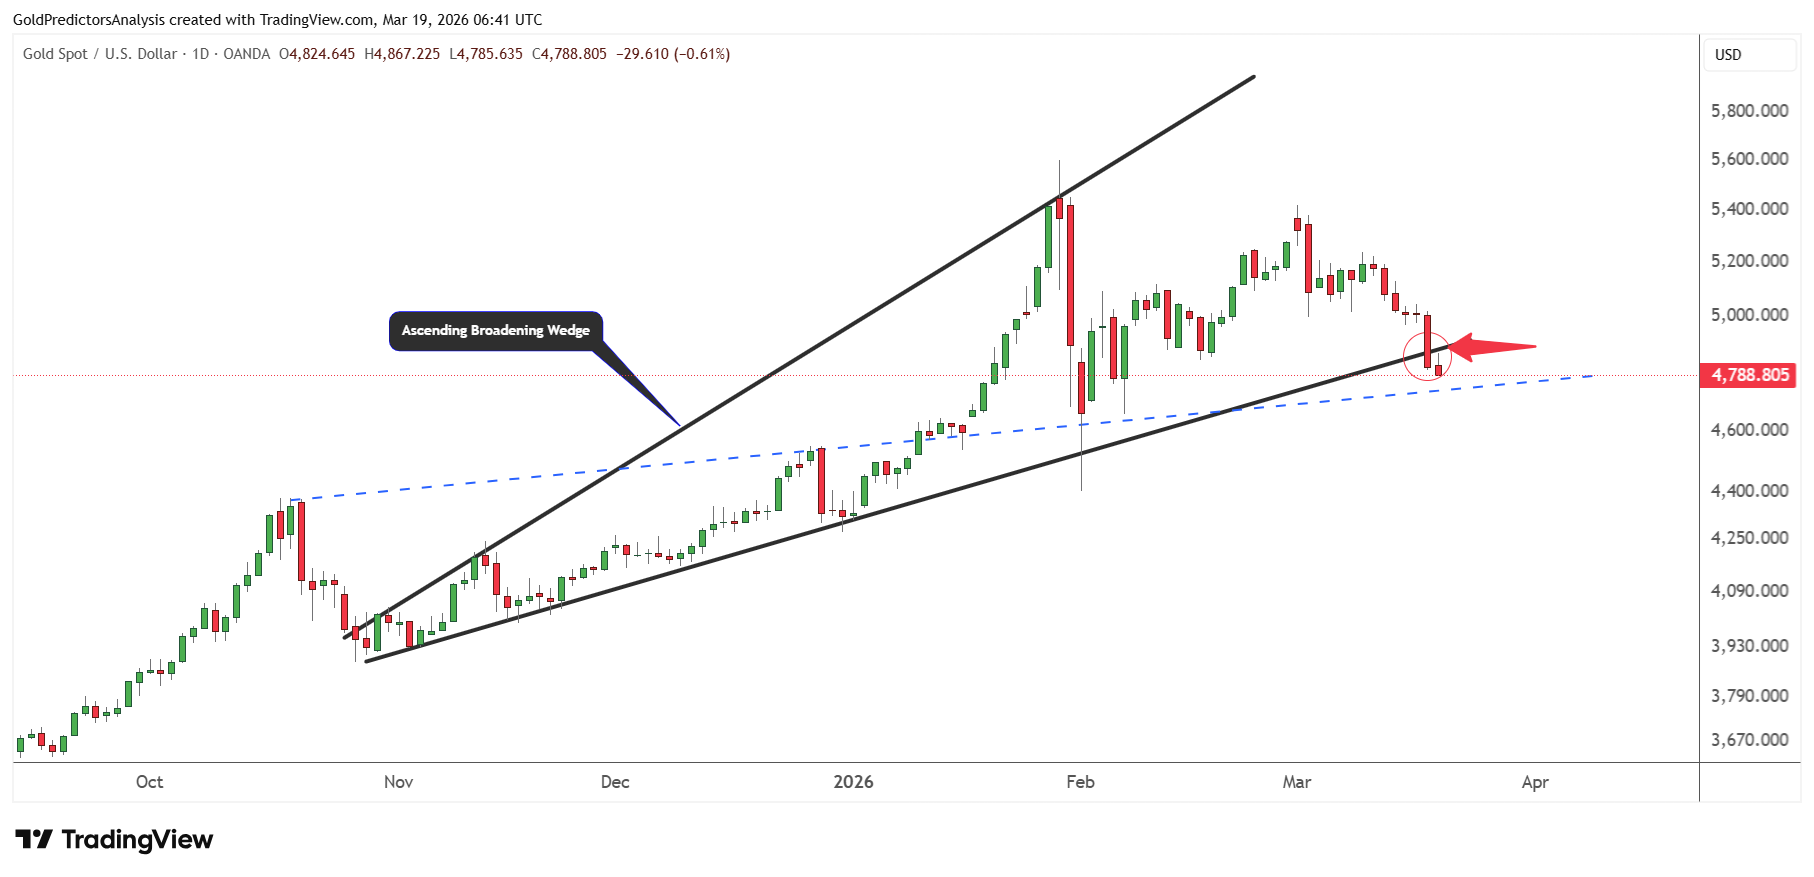
The strong support in the gold market remains in the $4,500 region. However, a minor support at $4,700-$4750 at the blue dotted trend line is also observed.
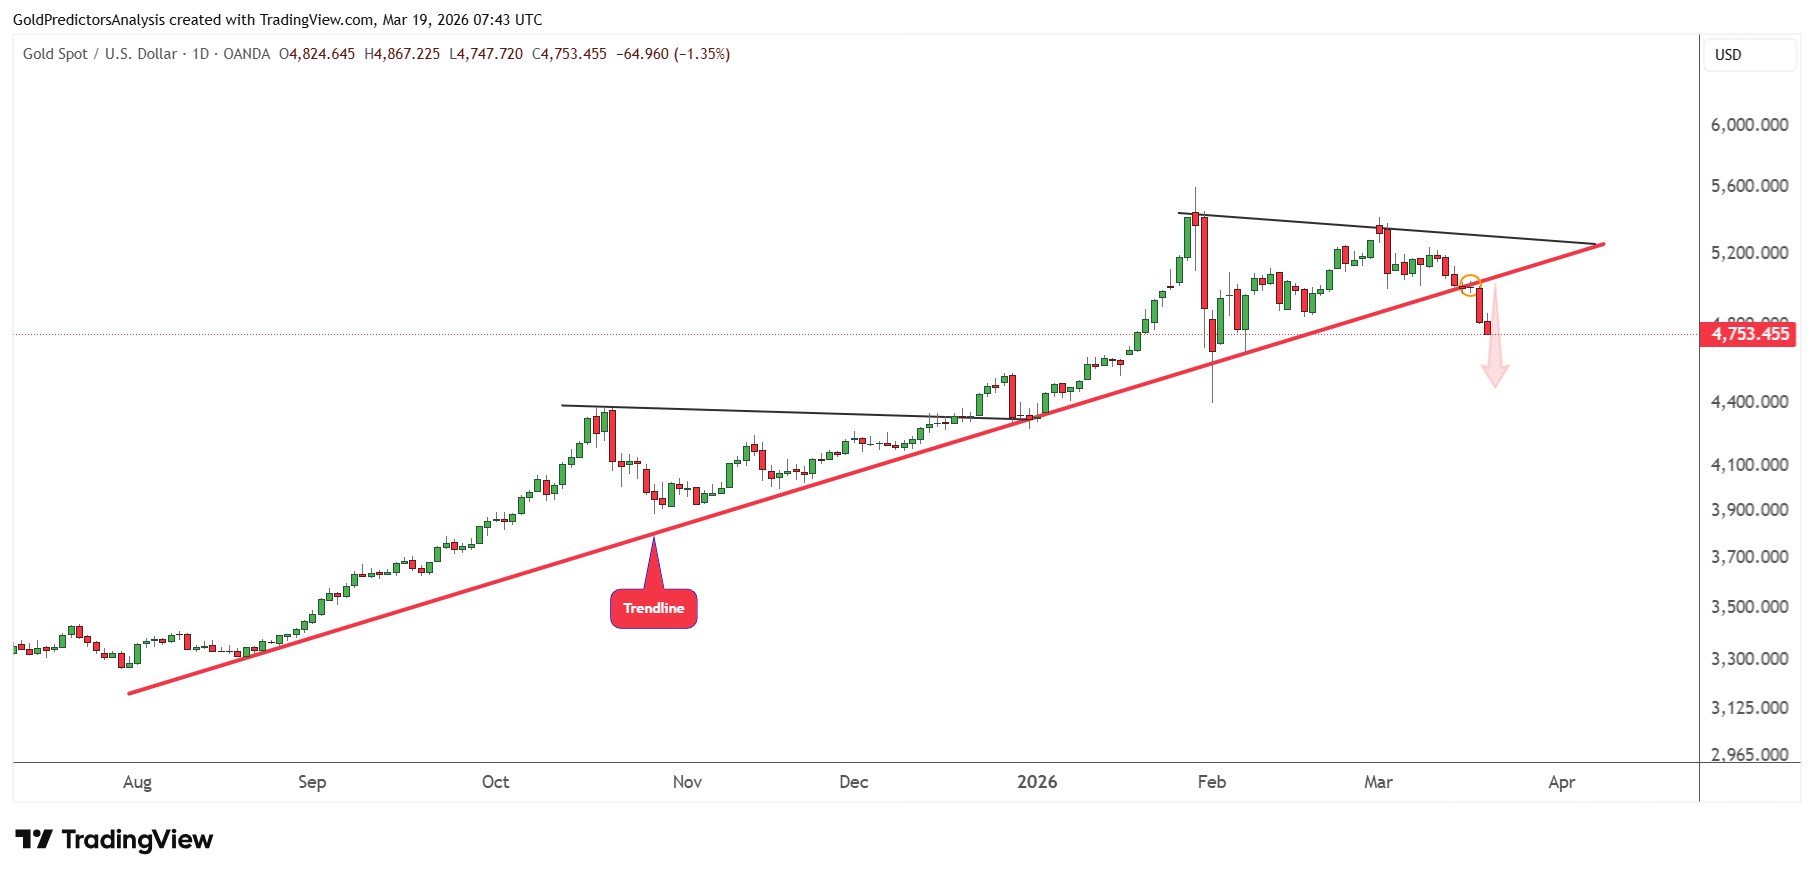
This drawdown in the gold market also broke the immediate uptrend that was initiated in the last quarter of 2025. However, the broader uptrend has remained in place since 2022. As long as $4,500 holds, gold prices may rebound strongly to higher levels.
Historical Corrections Point to Potential Rebound
The strong correction in gold during the geopolitical crisis and market uncertainty is very normal. Prices normally adjust before creating the next move. It is observed that the COVID-19 crisis produced a drop from a high of $1,700 on 9 March 2020 to a low of $1,451 on 16 March 2020 within just a few days.
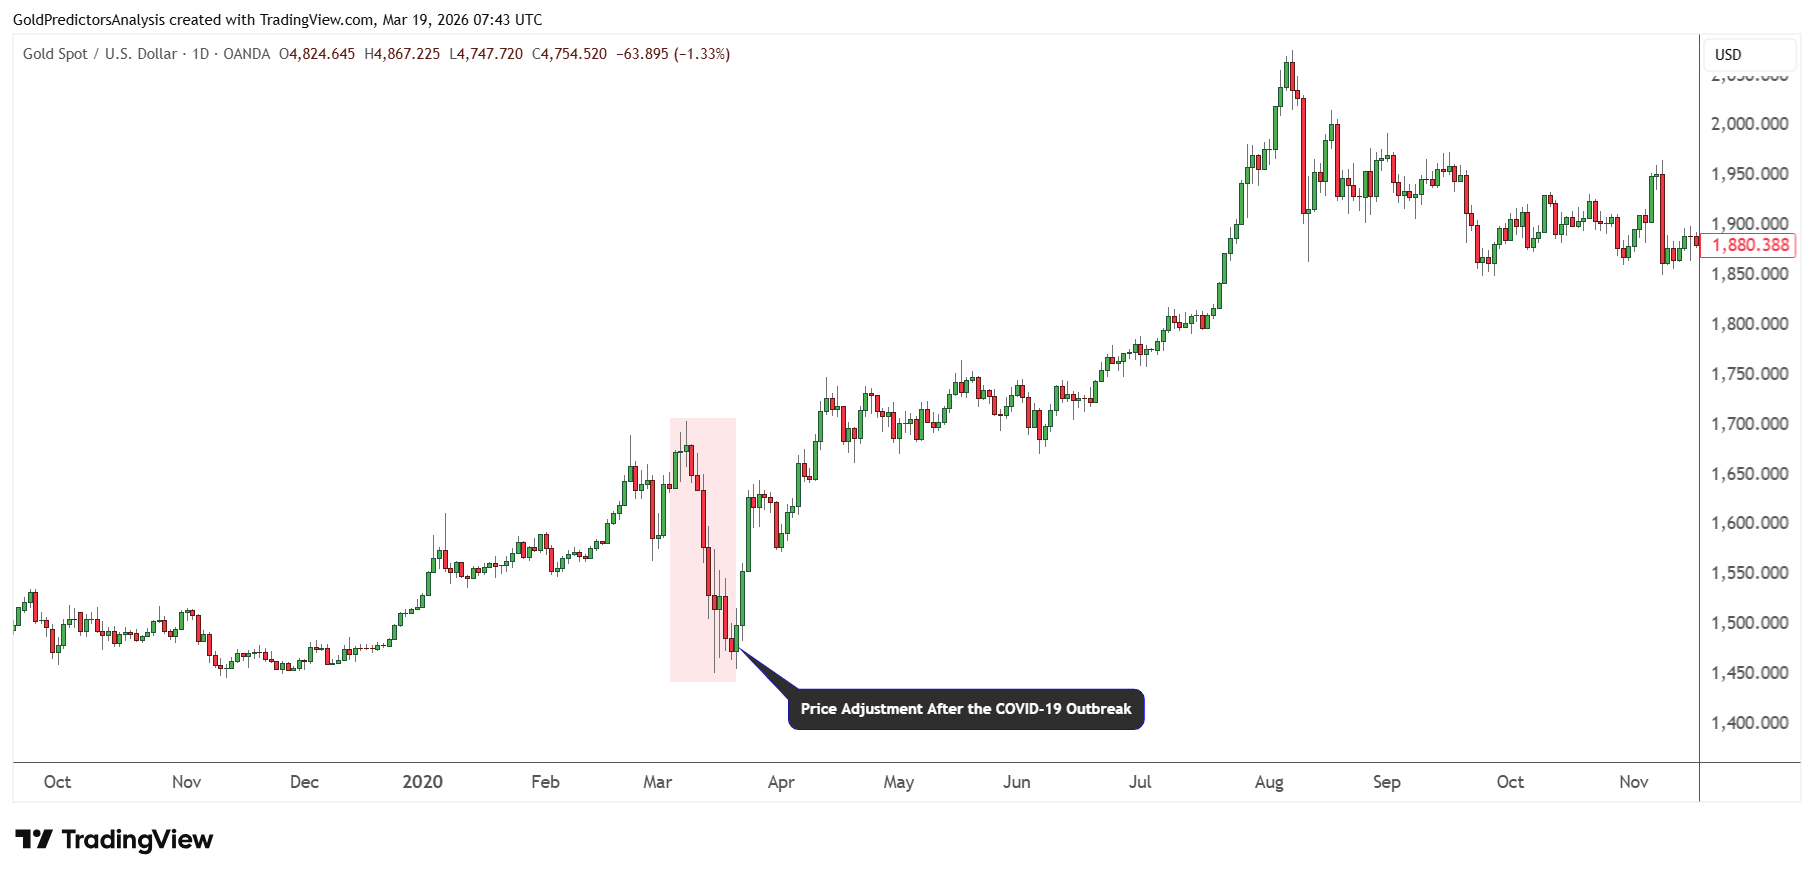
Then, prices surged higher to mark a high above $2,000 in August 2020 within the same year. The same scenario might be building again in 2026. The ongoing fundamentals and market uncertainty point to a similar outcome. The price may drop during the initial shock of US-Iran war and then find a bottom to surge higher, when dust is clear.
Market Risks
The key risk in the gold market is from a sudden easing in geopolitical tensions. If things in the Middle East settle down, energy supply fears might disappear. The prices of oil and LNG could drop dramatically. This would reduce inflationary pressure throughout the economy. In that case, the Federal Reserve may get back its confidence to cut rates as expected. Lower inflation may lead to a decrease in demand for safe havens.
Another risk is from better economic conditions and tighter monetary conditions. If inflation decelerates despite high energy prices, the Fed may remain restrictive for an extended period. Higher real yields and a stronger dollar would put pressure on gold prices. At the same time, continued volatility could lead to further profit taking after the strong rally in 2025. A break below $4,000 will invalidate the bullish outlook and will introduce deep correction.
Final Thoughts
Gold has strong support from the energy disruptions, rising inflation and tightening liquidity. The recent correction in gold is due to the profit taking after a strong rally in 2025. The uncertainty in the Middle East is also creating volatility in the financial markets. Despite the strong correction in gold, the broader picture remains bullish. As long as the $4,500 support holds, the odds are for a rebound to higher levels in the next few months. Geopolitical risks and tight monetary policy continue to provide source of demand for safe haven assets.
Moreover, the combination of high levels of debt and low policy flexibility also supports long term bullish outlook for gold. However, a break below $4,000 would indicate a deeper correction and delay the recovery.
If you’d like to know more about how to trade gold and silver, please visit our educational area.